
5G vs 4G Speed Test Results: What You’ll Actually See (and Why Your Tests Don’t Match Your Friend’s)
I’ve been using 5G long enough that the honeymoon period is over—and now it’s just “my phone, in my neighbourhood, on my commute.” And yeah: you run a speed test, your friend runs a speed test, and somehow your shiny “5G” looks worse than plain old LTE.
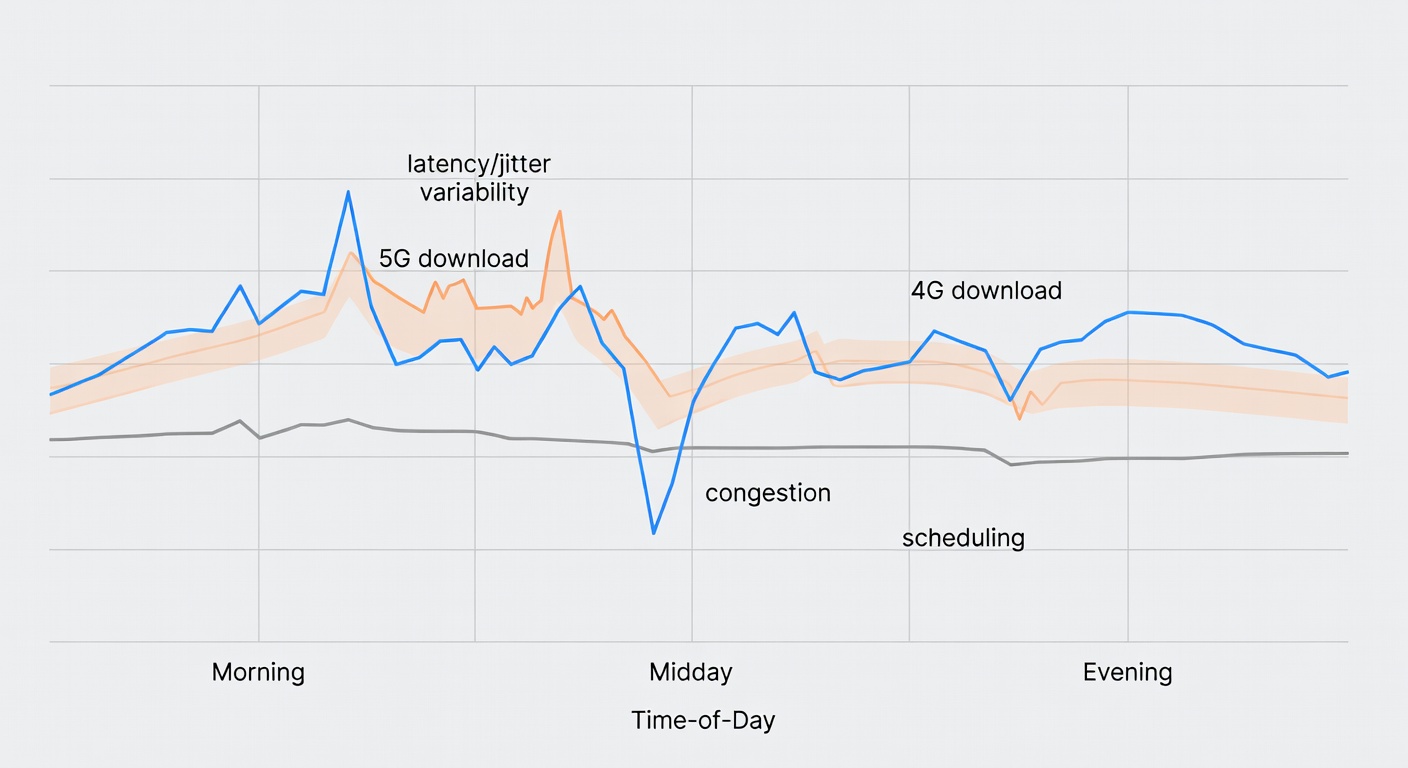
What’s going on is boring, but useful: your result is a mash-up of band (which flavour of 5G you’re on), signal quality (especially indoors), and congestion (time-of-day). Speed-test screenshots capture a moment. Your daily life is a pattern.
The practical takeaway I’m aiming for here: use speed tests to diagnose, not to brag—and lean on page-load/latency consistency when you’re trying to answer “does this feel faster?” Ookla’s page-load analysis is the more useful lens, and it explains why results swing wildly by location, band, and load. (Ookla, Tom’s Guide)
Key Takeaways
- If you care about “feels fast,” 5G usually wins. In Ookla’s Q1 2024 analysis across nine countries, 5G had faster page-load speeds than 4G on Google/YouTube/Facebook in every country surveyed—but the size of the win varied a lot. (Ookla)
- Speed ≠ consistency. A network can post big download numbers and still feel flaky for video calls, payments, or streaming. Opensignal’s framing is blunt: “Fast doesn’t always mean reliable.” (Opensignal)
- Yes, 5G can be slower than LTE. Low-band 5G, weak signal, or congestion can make your “upgrade” look like a downgrade. (Tom’s Guide)
- There’s a battery tax. Tests cited by Batteries Plus put 5G at roughly 6%–11% more drain than 4G LTE on average, and weak 5G is often the worst case. (Batteries Plus)
- Coverage maps are a starting point, not proof. They can be… optimistic. The FCC’s MF-II investigation is basically the grown-up version of that complaint: field testing often didn’t match predicted coverage/speeds. (FCC)
Carrier-specific reality (U.S.): T-Mobile vs Verizon vs AT&T
If you’re in the U.S., “5G” isn’t one thing—it’s three big networks making different trade-offs. The quick read from independent reporting:
- T-Mobile tends to win on 5G speed and 5G reach (great when you’re in a solid 5G area). Ookla’s H2 2024 report had T-Mobile as the fastest for 5G median download (281.52 Mbps). (Ookla) Opensignal also gives T-Mobile the 5G Coverage Experience win. (Opensignal)
- Verizon tends to win on broad “I have signal” coverage—and that matters when you’re indoors, on highways, or in older buildings. Opensignal’s overall Coverage Experience leader is Verizon (9.6/10). (Opensignal) Speedtest Awards also named Verizon the winner for mobile coverage in Q3–Q4 2024. (Speedtest Awards)
- AT&T is often the “middle path”—not always the headline winner, but frequently competitive depending on your city and indoor situation. (And yes, that “depending” is the entire point.)
Okay, so what does that mean in practice? If your problem is peak speed (big downloads, hotspot, dense city 5G), you’ll often like T-Mobile. If your problem is dead zones and indoor reliability, Verizon’s coverage advantage can matter more than a 600 Mbps screenshot. And if your issue is one specific neighbourhood or building, the only honest answer is: test that spot.
One more wrinkle: carrier maps and “coverage claims” can be wrong in the real world. The FCC’s MF-II staff report found submitted coverage maps likely overstated on-the-ground performance; in drive tests, predicted minimum speeds were met only 62.3% of the time overall. (FCC)
Quick carrier comparison (what to expect, what to test)
| Carrier | Typical 5G strength | Common weak spot | Best-case scenario | What to test at home | When LTE lock makes sense | When switching carriers makes sense |
|---|---|---|---|---|---|---|
| T-Mobile | Fast 5G and lots of it; strong 5G Coverage Experience. (source) | Indoor weak-signal “hunting” can spike battery and make results swing. | Consistently high 5G speeds (median 281.52 Mbps in H2 2024). (source) | Indoor couch spot vs window vs outside; peak-hour hotspot test. | If 5G is “there but weak” indoors and your phone runs hot/drains fast. | If your commute/home has repeat dead zones and LTE isn’t stable either. |
| Verizon | Overall coverage leader; often the “it just works” pick. (source) | You may see slower 5G speeds than T-Mobile in some areas. | Fewer total no-service moments; strong coverage awards. (source) | Basement/elevator test; call stability; “can I pay for stuff?” reliability. | If 5G is fine but jittery during peak hours—LTE can be steadier. | If you’re getting consistent dead zones indoors and outdoors in the same places. |
| AT&T | Often competitive overall; can be a solid “balanced” option depending on market. (source) | Performance can be very location-dependent—test your exact spots. | Good day-to-day experience when your local network is strong. | Same-room repeatability (3–5 runs); upload for calls; evening congestion. | If 5G toggles a lot and you care more about battery than peak speed. | If your home/work are consistently congested and you can’t fix it with placement/LTE lock. |
If you’re outside the U.S.: how to map your carrier to the same trade-offs
The framework still works anywhere: figure out whether your carrier’s 5G in your area is mostly low-band (coverage), mid-band (speed + coverage balance), or mmWave (hotspot-fast, distance-fussy). Then test indoors vs outdoors and at peak vs off-peak.
- Look up your local 5G bands (search: “[carrier] 5G bands” + terms like n78, n77, n41). This doesn’t guarantee performance, but it tells you what kind of 5G you’re likely seeing.
- Treat coverage maps as a hypothesis. Real-world verification matters; even regulators have found map-to-reality gaps. (FCC)
- Prefer third-party metrics that reflect daily use: median speeds (not peak), latency, and consistency/reliability framing. (Ookla, Opensignal)
What counts as a “speed test result” (and what it misses)
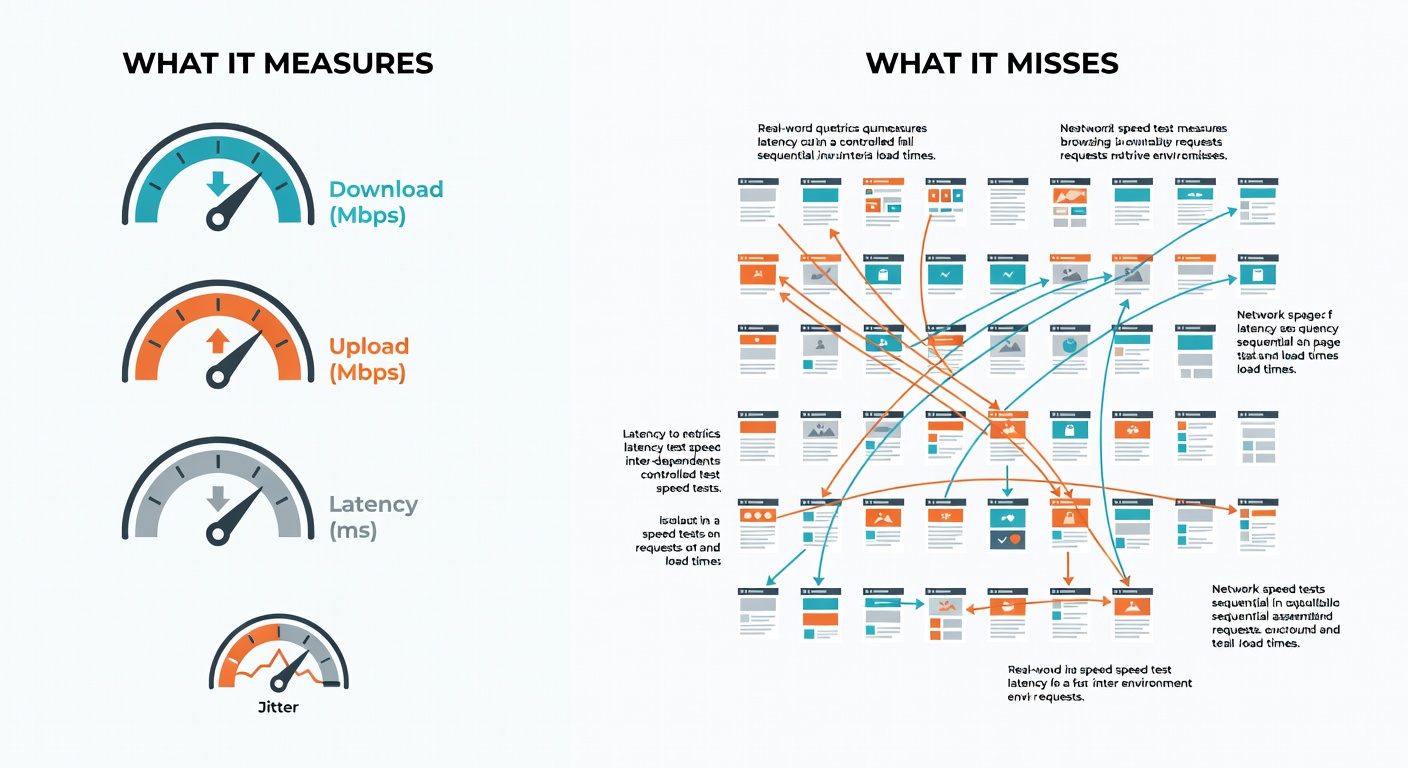
Most speed tests give you three numbers: download, upload, and latency/ping. Then there’s jitter—how much latency bounces around—which is why a call can sound fine and then suddenly turn into robot soup.
The catch: a lot of what “feels fast” is many small requests, not one big download. Ookla notes a typical web request can require two to five round trips, and page-load speed is directly impacted by latency. (Ookla)
So a network that’s “only” 80 Mbps but with steadier latency can feel better than a 300 Mbps connection that spikes and stalls. If your buying decision is “Do I notice 5G day-to-day?” care at least as much about latency + jitter + page-load as peak download.
Real-world 5G vs 4G results: page-load wins (QoE) are often clearer than raw Mbps
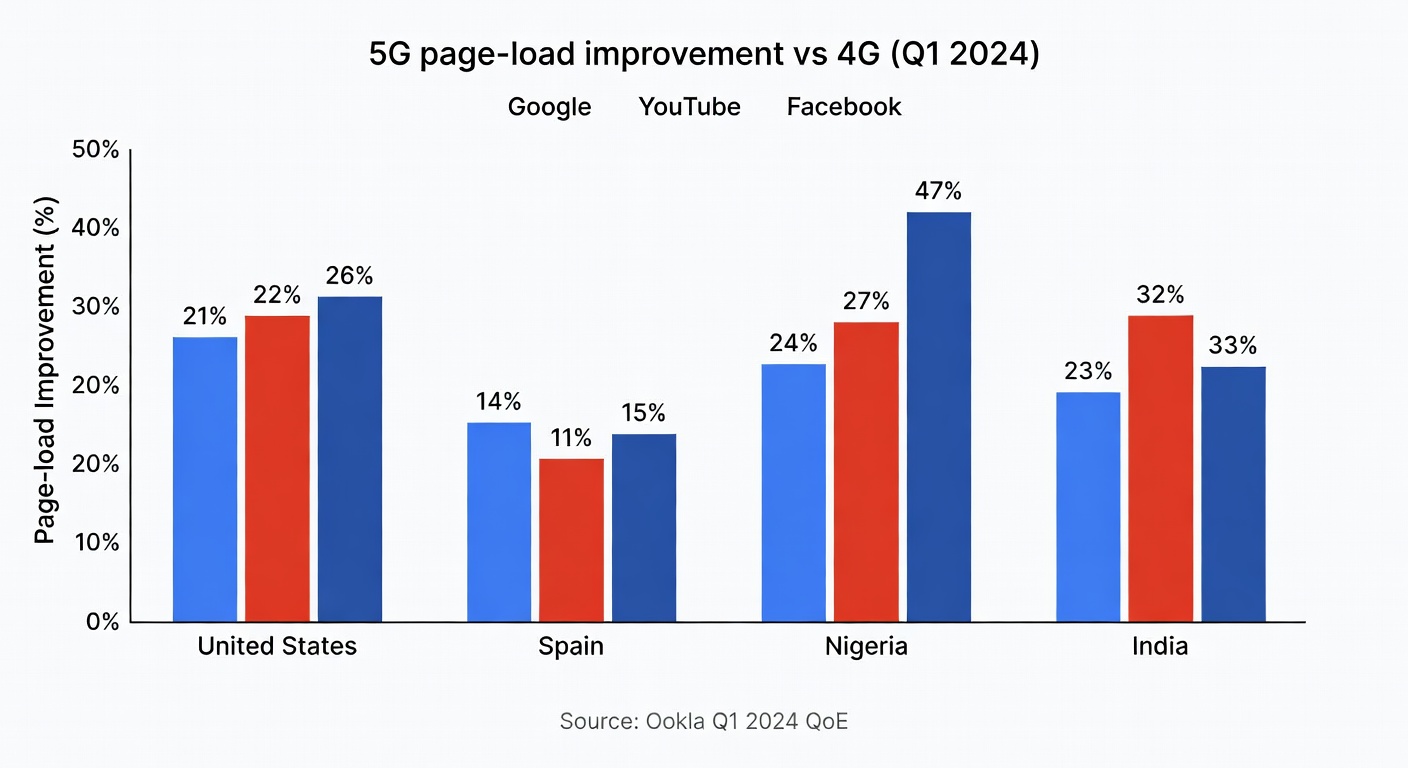
Ookla looked at page load speed (milliseconds to fully load) for Google, YouTube, and Facebook using Speedtest Quality of Experience data across nine countries in Q1 2024. The headline: 5G was faster on all services in all countries surveyed, but the improvement wasn’t uniform. (Ookla)
A few standout deltas (5G faster than 4G):
| Country (Q1 2024) | YouTube | ||
|---|---|---|---|
| United States | 21% | 22% | 26% |
| Spain | 14% | 11% | 15% |
| Nigeria | 24% | 27% | 47% |
| India | 23% | 32% | 33% |
Source: Ookla’s Q1 2024 page-load analysis. (Ookla)
That’s the part nobody mentions when they’re arguing about “my 5G hit 612 Mbps once.” For commute-life browsing, you don’t need gigabit speeds—you need the phone to stop waiting.
Use-case guide: what matters for gaming, calls, streaming, browsing, and hotspots
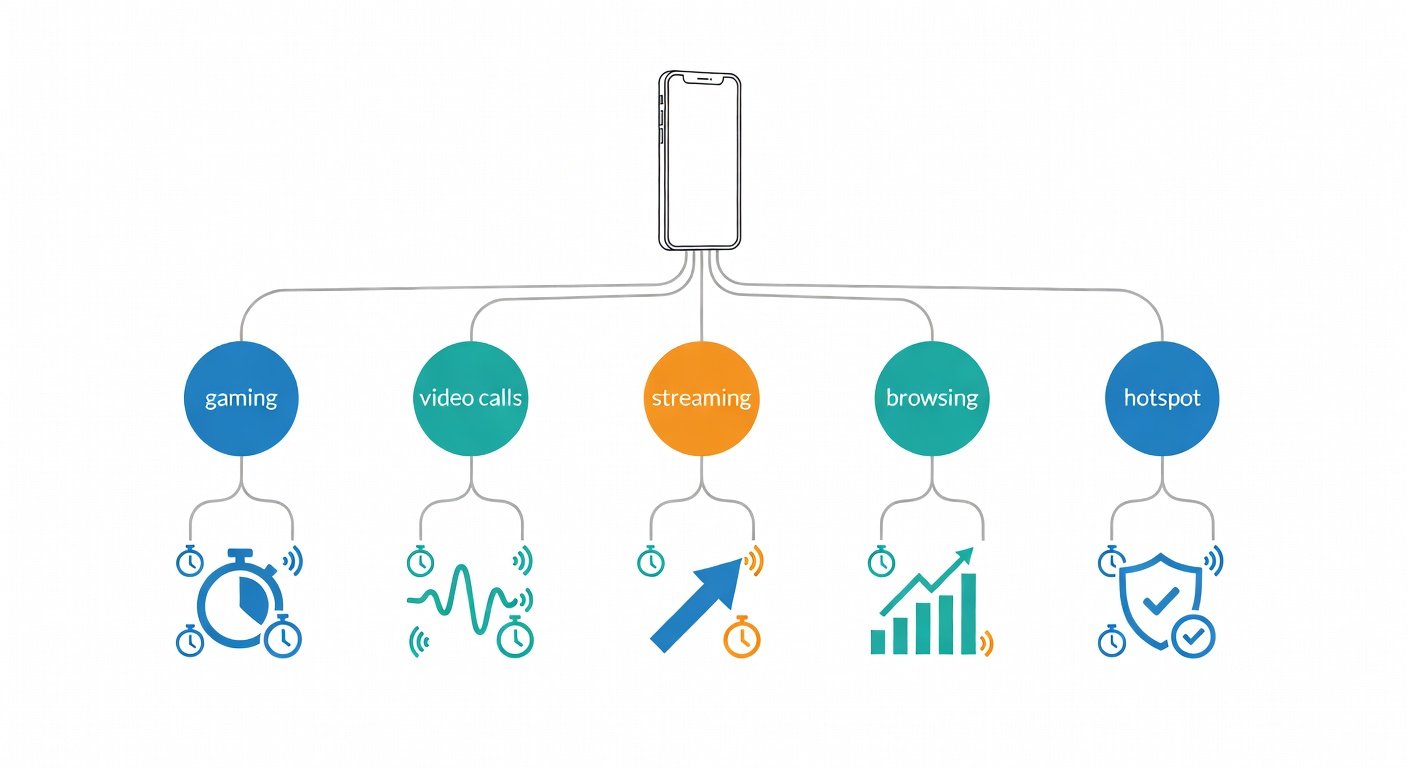
Different apps care about different metrics. If you only look at download Mbps, you’ll miss why your call stutters on a “fast” connection.
Decision table (rule-of-thumb targets)
| Use case | Prioritize (metric) | “Good enough” targets | Best choice | Notes |
|---|---|---|---|---|
| Competitive gaming | Latency + jitter consistency | Rule-of-thumb: low, stable ping; jitter “small and boring” | Depends | A slower-but-steady LTE link can beat spiky 5G. (This is the “fast ≠ reliable” problem.) (source) |
| Video calls (Zoom/FaceTime) | Upload + stability (jitter) | Rule-of-thumb: consistent uplink matters more than peak downlink | Depends | If 5G is weak indoors, LTE lock can reduce “radio hunting” and glitches. |
| Social browsing | Page-load/latency | 5G often wins by ~10–30% in page-load in Ookla’s Q1 2024 sample | 5G | This is where 5G “feels” faster even when Mbps isn’t dramatic. (source) |
| Music streaming | Consistency | Rule-of-thumb: modest throughput, low dropouts | LTE | LTE is usually plenty unless you’re in a truly congested area. |
| 4K video streaming | Sustained throughput + stability | Rule-of-thumb: steady speed beats peak speed | 5G | If your 5G is spiky, LTE can still be the “less annoying” option. |
| Large downloads / updates | Download throughput | Higher is better (obviously), but watch for throttling/congestion | 5G | This is where T-Mobile’s median 5G speed lead can show up. (source) |
| Mobile hotspot (laptop) | Sustained down + upload + reliability | Rule-of-thumb: stable connection over long sessions | Depends | Test at peak hours. A “fast” network that collapses at 6–10pm isn’t a win. |
| IoT / smart devices | Reliability (staying connected) | Rule-of-thumb: fewer drops > more Mbps | LTE | Most IoT doesn’t need 5G speeds; it needs boring stability. |
Targets above are conservative rule-of-thumb ranges, not guarantees; real-world reliability varies by location and congestion. For the “why,” see Ookla’s latency/page-load framing and Opensignal’s reliability point. (Ookla, Opensignal)
Buy 5G for the right reason and you’ll be happy. Buy it for the marketing reason and you won’t.
Why your 5G test can be slower than 4G (yes, that happens)
Three pillars explain 95% of “why is my 5G worse?” moments:
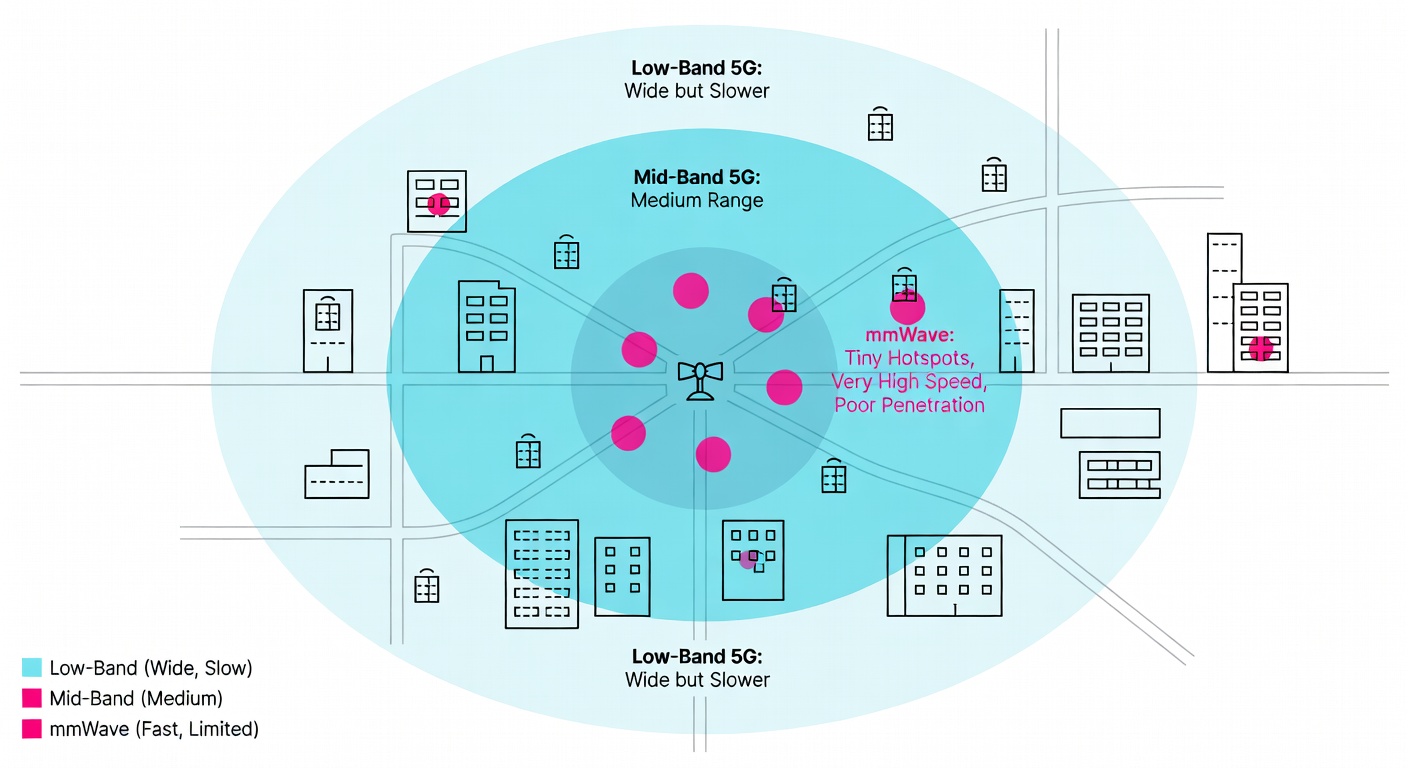
1) Band/implementation: you’re on the “coverage” layer, not the “speed” layer
Tom’s Guide lays out the trade: mmWave is very fast but doesn’t carry far and struggles with barriers, while broader “nationwide” 5G layers trade speed for coverage. (Tom’s Guide)
2) Signal quality: indoors changes everything
Weak 5G indoors is the classic trap. Move a short distance (sometimes 10 feet toward a window) and your results can flip.
3) Congestion: same spot, different hour, different network
Your “slice” of capacity changes with load. That’s why one person’s lunchtime test doesn’t match another person’s 7pm test.
Reality-check mini checklist (then jump to the full protocol below):
- ☐ Run 3 tests per mode (5G and LTE), not one.
- ☐ Repeat at two times (off-peak vs evening).
- ☐ Try indoors vs window vs outside.
Speed vs consistency: the part speed tests don’t warn you about
Opensignal’s Global Network Excellence Index write-up makes the point carriers don’t: “Fast doesn’t always mean reliable.” (Opensignal)
- A speed test can look great, but your video call still freezes.
- You can hit 400 Mbps once, but tap-to-pay still spins.
- Streaming can buffer because your connection is spiky, not because peak speed is low.
Practical suggestion: for a week, do two quick tests a day in the same spots and note download + upload + latency plus whether anything failed (page didn’t load, stream dropped, call glitched). If LTE is simply less annoying where you live, locking to LTE isn’t “giving up.” It’s choosing fewer paper cuts.
Battery and heat: the hidden cost of chasing 5G all day
Batteries Plus summarizes it as the “10% Rule”: tests show 5G drains roughly 6% to 11% more battery than 4G LTE on average. (Batteries Plus)
- Weak 5G is brutal because the phone “hunts” for signal. (Batteries Plus)
- NSA “dual connection” can cost power (maintaining 4G + 5G). (Batteries Plus)
Settings that actually help:
- iPhone: 5G Auto (Smart Data Mode) instead of forcing 5G. (Batteries Plus)
- Android: Adaptive Connectivity (varies by brand). (Batteries Plus)
- Force LTE on endurance days (travel, low-signal office, long GPS).
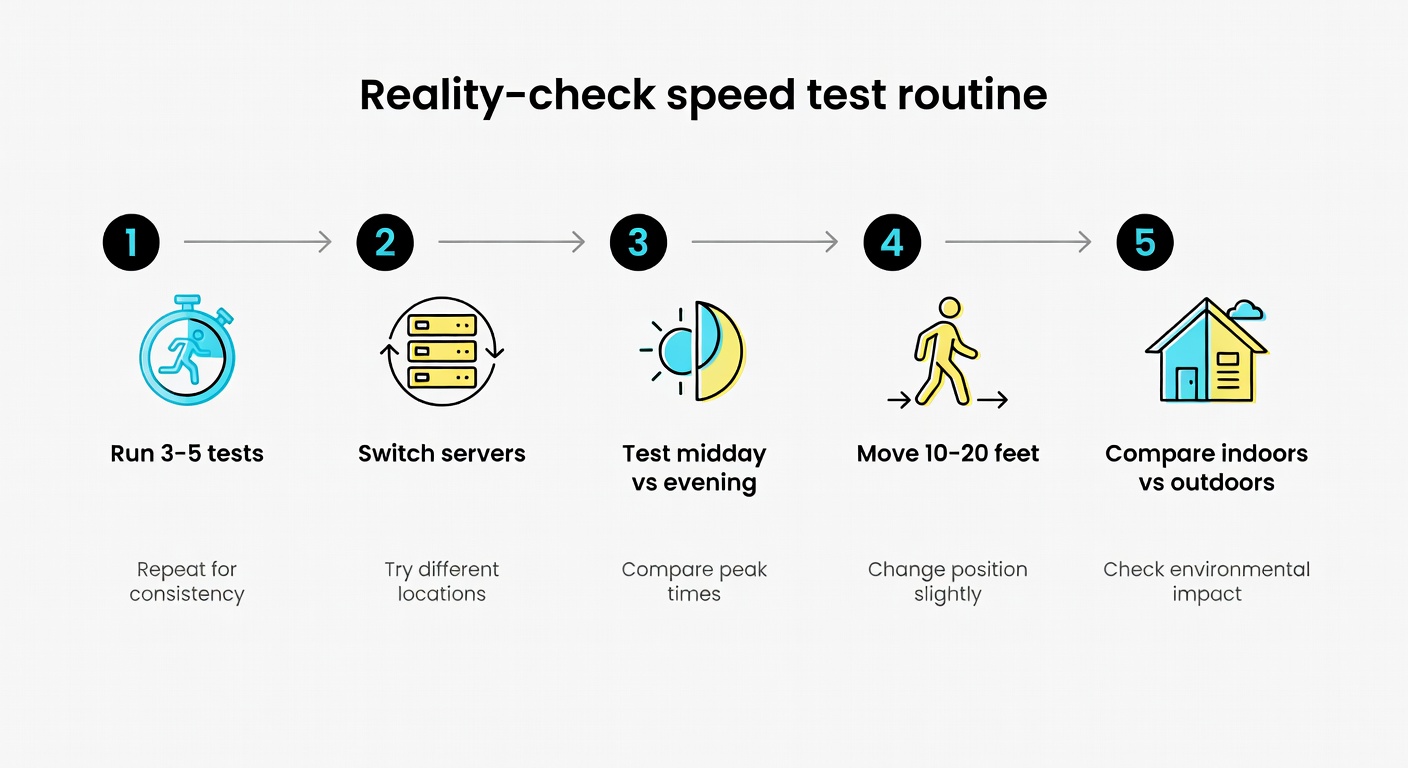
How to run a fair 5G vs 4G speed test (so your results mean something)
Here’s the one protocol I’d actually trust—tight enough to be useful, not so fussy you’ll never do it.
- Pick one exact spot (same chair, same room). Disable Wi‑Fi.
- Turn off VPN (if you use one). Close big background downloads.
- Toggle Airplane Mode on for 10 seconds, then off (resets the radio).
- In your speed-test app, pick one server and stick with it for this run.
- Run 3–5 tests on 5G. Record download, upload, latency, jitter (if shown).
- Force LTE/4G. Repeat 3–5 tests with the same server.
- Repeat the whole thing at a different time of day (off-peak vs evening).
Common mistakes (that make your data basically useless)
- ☐ Wi‑Fi still on (or Wi‑Fi Assist doing weird handoffs)
- ☐ VPN on
- ☐ One single run (“hero screenshot”)
- ☐ Different servers between 5G and LTE runs
- ☐ Testing in different spots (even a few feet can change signal quality)
And don’t treat coverage maps as proof. The FCC’s MF-II staff report found real-world tests often didn’t match predicted coverage/speeds—exactly why you should test where you actually live and work. (FCC)
A simple at-home test plan (and a template you can copy)
If you want “author-style” data without buying tools, do this for 2–3 days:
- Locations: (1) home indoor (couch/desk), (2) home window or balcony/outside, (3) one commute stop or work spot.
- Times: off-peak (late morning/afternoon) and peak (6–10pm).
- Runs: 3 tests on 5G + 3 tests on LTE per location/time.
- Also log one real task: load a heavy site, start a video call, or start a stream—did it fail or stutter?
| Date/Time | Location | Mode | Down (Mbps) | Up (Mbps) | Latency (ms) | Jitter (ms) | Real task note (loaded? stutter?) |
|---|---|---|---|---|---|---|---|
| ____ | Home (couch) | 5G | ____ | ____ | ____ | ____ | ____ |
| ____ | Home (couch) | LTE | ____ | ____ | ____ | ____ | ____ |
| ____ | Commute stop / Work | 5G or LTE | ____ | ____ | ____ | ____ | ____ |
If you’re shopping carriers in 2026: use a trial/eSIM if you can, and test home/work/commute before you commit. Pick based on the one thing you can’t tolerate: speed, consistency, or battery drain.
Sources
- Ookla: How Much Faster is 5G Anyway? (Page Load Speed, Q1 2024)
- Tom’s Guide: 5G vs. 4G performance compared
- Opensignal: Global Network Excellence Index (Feb 2026)
- Opensignal: USA Mobile Network Experience Report (Jan 2025)
- Ookla: Speedtest Connectivity Report, United States H2 2024
- Speedtest Awards: United States 2024 (Coverage winner details)
- FCC: Mobility Fund Phase II Coverage Maps Investigation Staff Report
- Batteries Plus: Does 5G Kill Your Battery? (updated Jan 2026)
- Steel in the Air: Coverage map accuracy assessment


Leave a Reply