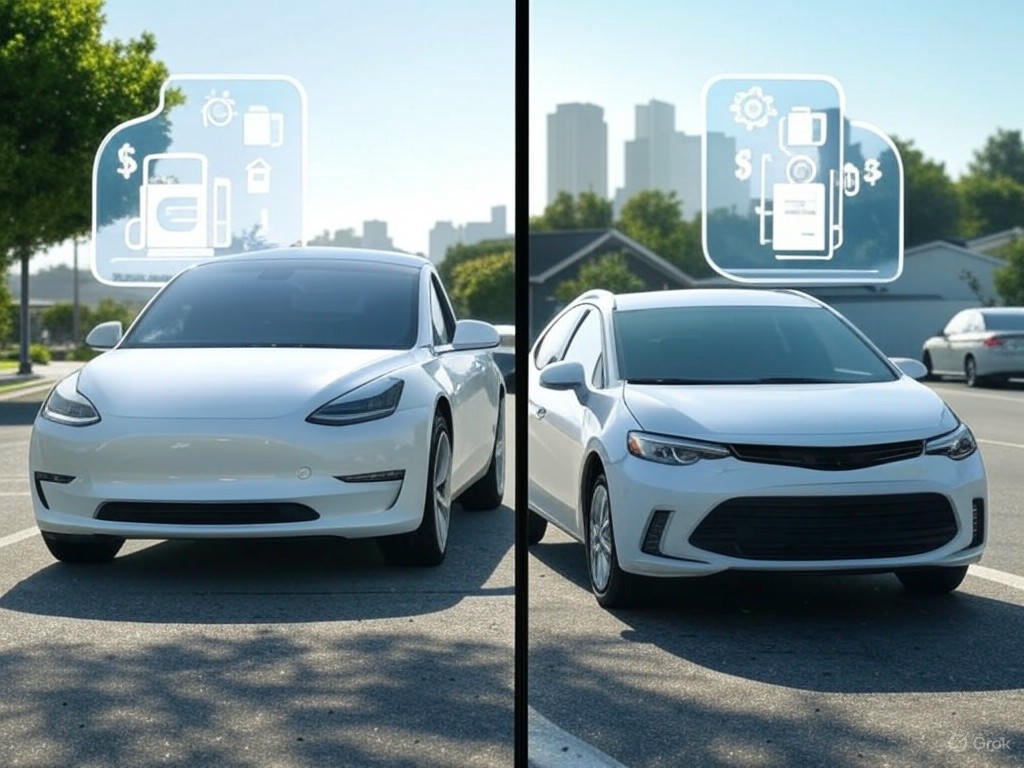
Electric vs Gas Car Costs: 5-Year Ownership Breakdown 2025
- Introduction: Framing the 5-Year Cost Ownership Debate for Electric vs Gas Cars in 2025
- Introduction: Framing the 5-Year Cost Ownership Debate for Electric vs Gas Cars in 2025
- Why the 5-Year Timeframe Matters
- Breaking Down Total Cost of Ownership Components
- Market Dynamics and Emerging Trends in 2025
- Setting Expectations for This Analysis
- Technical Specifications and Cost Components Breakdown
- Technical Specifications and Cost Components Breakdown
- Battery Capacity, Motor and Engine Efficiency, and Fuel Tank Size
- MSRP Ranges in 2025: EVs vs. Gasoline Models
- Fuel and Energy Costs Per Mile
- Maintenance Intervals and Service Costs
- Insurance Premiums: Higher but Manageable for EVs
- Depreciation Rates: Improving but Still Variable
- Charging Infrastructure and Installation Costs
- Warranty Coverage Specifics
- Summary
- Fuel and Energy Costs Analysis: Efficiency, Regional Variability, and Charging Strategies
- Fuel and Energy Costs Analysis: Efficiency, Regional Variability, and Charging Strategies
- Efficiency: MPGe vs. MPG in 2025
- Regional Variability in Energy Costs
- Charging Modalities and Their Cost Implications
- Off-Peak Charging and Time-of-Use (TOU) Rates
- Energy Cost Comparison for Typical Annual Mileage
- Maintenance, Repairs, and Insurance: Long-Term Cost and Reliability Insights
- Maintenance, Repairs, and Insurance: Long-Term Cost and Reliability Insights
- Maintenance and Repair Costs: Quantifying the Differences
- Insurance Costs and Risk Factors in 2025
- Resale Value and Battery Warranty Considerations
- Practical Takeaways
- Performance and User Experience Implications on Ownership Costs
- Performance and User Experience Implications on Ownership Costs
- Acceleration and Driving Dynamics: Beyond 0-60 mph
- Range and Refueling/Recharging: Core Convenience Factors
- Real-World Usage Scenarios and Infrastructure Impact on Costs
- Downtime for Maintenance and Charging: Hidden Ownership Costs
- User Experience Insights: Driver Feedback
- Summary: Performance and User Experience Shape Ownership Costs
- Comparative Cost Benchmarking: EVs vs Gas Cars Across Different Use Cases and Regions
- Comparative Cost Benchmarking: EVs vs Gas Cars Across Different Use Cases and Regions
- Ownership Costs by Vehicle Segment and Region
- Regional Variations: High Gas Price States vs Low Electricity Cost Areas
- Sensitivity to Annual Mileage, Charging Behavior, and Depreciation
- Hybrid Alternatives in the Cost Equation
- Summary Table: Approximate 5-Year Ownership Cost Differentials by Vehicle Class and Region
- Final Takeaways
- Final Verdict and Evidence-Based Recommendations for 2025 Buyers
- Final Verdict and Evidence-Based Recommendations for 2025 Buyers
- When EV Ownership Makes the Most Financial Sense
- Where Gas Cars Still Hold Advantages
- Practical Recommendations for 2025 Buyers
- Transparency on Limitations and Future Trends
- Bottom Line

Introduction: Framing the 5-Year Cost Ownership Debate for Electric vs Gas Cars in 2025

Introduction: Framing the 5-Year Cost Ownership Debate for Electric vs Gas Cars in 2025
Evaluating the total cost of owning an electric vehicle (EV) versus a gasoline car over a five-year period remains a crucial consideration for consumers and policymakers alike in 2025. While EVs typically carry a higher upfront price—averaging around $55,544 compared to $49,740 for new gas-powered cars as of late 2024—the ownership cost equation is far more complex once all factors are considered. These include purchase price, fuel or energy expenses, maintenance, insurance, depreciation, and available incentives.
Why the 5-Year Timeframe Matters
A five-year ownership horizon is a practical benchmark that reflects common vehicle ownership periods and aligns with typical warranty durations. This timeframe captures not only the initial acquisition costs but also ongoing operational expenses and depreciation patterns that significantly influence real-world affordability.
For instance, gasoline cars usually have a lower sticker price but often face increasingly unpredictable repair costs as mileage accumulates. Conversely, EVs benefit from simpler drivetrains with fewer moving parts, resulting in lower maintenance expenses despite their historically higher upfront cost.
Breaking Down Total Cost of Ownership Components
To accurately compare value between EVs and gasoline cars, it’s essential to analyze the key cost components:
-
Purchase Price: Despite notable reductions, EVs remain on average about $5,800 more expensive upfront than comparable gas vehicles after accounting for incentives. Federal tax credits of up to $7,500 in the U.S. can significantly narrow—or even reverse—this price gap for eligible buyers.
-
Fuel/Energy Costs: EVs demonstrate compelling efficiency advantages, traveling between 2.6 to 4.8 times more miles per unit of energy than internal combustion engines. Home charging costs can be as low as 7 cents per mile in the UK, or about $6 to $18 for a full charge in the U.S. using a Level 2 charger. By contrast, average U.S. gasoline prices hovered around $3.17 per gallon in May 2025, translating to roughly 10.6 cents per mile for typical sedans.
-
Maintenance and Repairs: EV maintenance costs are approximately half those of gasoline cars. The absence of oil changes, fewer moving engine parts, and regenerative braking systems contribute to reduced wear and tear. In comparison, gasoline vehicles may incur unpredictable and rising repair bills as they age.
-
Insurance and Taxes: Insurance premiums vary by model and location but tend to be comparable overall, though EVs often carry a premium of about 26% due to specialized repair costs and higher vehicle values. Tax incentives, such as the UK’s reduced Benefit-in-Kind (BiK) rates or U.S. federal tax credits, further improve the ownership appeal of EVs.
-
Depreciation: EV depreciation has historically been steeper, with some models losing over 60% of their value within five years. However, improvements in battery technology, expanding pre-owned EV markets, and extended warranties are gradually stabilizing resale values. Gasoline cars still often depreciate less rapidly in certain markets.
Market Dynamics and Emerging Trends in 2025
The EV market in 2025 is at a pivotal juncture. Transaction prices for new electric cars have fallen by over $14,000 in the past year, and more affordable models are increasingly accessible—approximately 40% of EV units sold in some markets are priced below $25,000. Industry estimates anticipate full price parity with gasoline vehicles around 2026.
Regional variations significantly influence ownership costs. For example, in states like Nevada, where gasoline prices are high and electricity rates low, annual fuel savings from switching to an EV can exceed $1,200. In contrast, regions with lower gas prices and higher electricity costs may see more modest savings.
Technological advances are also reshaping the landscape. Breakthroughs in battery chemistry and the expansion of fast-charging infrastructure—including Tesla’s Supercharger network now broadly accessible—enhance convenience and reduce range anxiety. Additionally, emerging vehicle-to-grid (V2G) technologies promise to offset ownership costs by enabling EVs to supply energy back to the grid, though these remain in early stages.
Setting Expectations for This Analysis
This article strives to cut through marketing hype and anecdotal claims by anchoring its comparison in up-to-date data and real-world examples. We quantify cost components using the latest pricing, efficiency metrics, and maintenance data, while balancing these with practical considerations such as reliability, regional energy prices, and insurance trends.
Ultimately, the decision between an EV and a gasoline car in 2025 depends on individual driving patterns, local incentives, and lifestyle preferences. However, by employing a rigorous five-year total cost of ownership framework, this analysis provides the clarity needed to make an informed, evidence-based choice.
| Cost Component | Electric Vehicle (EV) | Gasoline Car |
|---|---|---|
| Average Purchase Price | $55,544 (before incentives) | $49,740 |
| Federal Tax Credits / Incentives | Up to $7,500 (U.S.) | None |
| Fuel / Energy Costs | 7 cents per mile (UK); $6–$18 per full charge (U.S.) | 10.6 cents per mile (U.S.) at $3.17/gallon |
| Maintenance and Repairs | Approximately half the cost of gas cars | Higher, with unpredictable repair costs as mileage increases |
| Insurance Premiums | About 26% higher due to specialized repairs and vehicle value | Comparable but generally lower |
| Tax and Other Incentives | Reduced BiK rates (UK), federal tax credits (U.S.) | None |
| Depreciation | Over 60% loss in value within 5 years (improving with technology) | Generally less steep depreciation |
| Market Trends (2025) | Prices dropped $14,000 in past year; 40% priced below $25,000; full parity expected ~2026 | Stable pricing |
| Regional Variations | High fuel savings in states with high gas/low electricity prices (e.g., Nevada: >$1,200/year) | Lower fuel savings in some regions |
| Technological Advances | Improved batteries, expanding fast-charging networks, emerging V2G tech | Traditional tech, fewer innovations impacting costs |
Technical Specifications and Cost Components Breakdown

Technical Specifications and Cost Components Breakdown
When comparing electric vehicles (EVs) and gasoline cars for ownership costs over a five-year span, the details matter—especially the technical specifications and cost factors that directly affect total expenditure. This section breaks down the key elements influencing ownership costs, relying on up-to-date 2025 data to provide a clear, factual comparison.
Battery Capacity, Motor and Engine Efficiency, and Fuel Tank Size
Battery capacity remains fundamental to EV range and cost. Mainstream EVs in 2025 typically feature usable battery capacities ranging from 50 kWh to over 110 kWh:
- The Mercedes-Benz EQS SUV Maybach carries about 71 kWh.
- Larger, performance-oriented models such as the BYD TANG Flagship and Volvo EX90 Twin Motor exceed 100 kWh.
- The Tesla Model 3 Long Range includes a 57.5 kWh battery, delivering approximately 678 km (421 miles) per charge—the benchmark for extended range EVs.
These capacities generally enable EVs to average around 300 miles per charge, with some luxury and touring sedans surpassing 500 miles. Higher battery capacity benefits long-distance travel convenience but correlates with increased upfront cost and potential replacement expenses.
Electric motor efficiency has seen significant improvements, spurred by Department of Energy (DOE) standards and industry innovation. Modern EV motors frequently exceed 90% efficiency, vastly outperforming internal combustion engines (ICE) that typically operate at 25-30% efficiency. This translates into much lower energy consumption per mile, creating immediate fuel cost savings for EV owners.
Gasoline vehicles, by contrast, have fuel tanks usually ranging from 12 to 21 gallons:
- The 2025 Toyota 4Runner holds 19 gallons of regular gasoline.
- The Nissan Sentra features a smaller 12.4-gallon tank and fuel economy ratings of 29 MPG city and 39 MPG highway.
While gasoline refueling is quicker, the lower thermal efficiency of combustion engines leads to higher fuel costs per mile compared to EVs.
MSRP Ranges in 2025: EVs vs. Gasoline Models
Purchase price remains a pivotal consideration. In 2025, average EV Manufacturer’s Suggested Retail Price (MSRP) falls between $57,000 and $105,000, varying by model and trim. Entry-level EVs like the Hyundai Kona SE start near $32,875. Representative prices include:
- Tesla Model 3 Long Range: Approximately $57,900
- BMW i7 eDrive50 Sedan: Around $105,700
- Audi Q4 e-tron SUV: $58,200 to $74,400 depending on trim level
Gasoline vehicles typically offer a broader and generally lower price spectrum:
- Compact sedans and hybrids such as the Nissan Sentra start from $20,000 to $25,000.
- Midsize SUVs like the Toyota Highlander Hybrid range from $38,000 to $40,000.
Although EVs usually carry a higher upfront cost, federal tax incentives (up to $7,500) and lower operating expenses for energy and maintenance often help offset this premium over the ownership period.
Fuel and Energy Costs Per Mile
Fuel costs vary significantly by location but consistently favor EVs. As of 2024, the average U.S. gasoline price was approximately $3.18 per gallon. A typical sedan averaging 30 MPG incurs fuel costs of around 10.6 cents per mile.
Electricity prices fluctuate more widely, with a national average near 13 cents per kWh. Given EV efficiency of about 3 to 4 miles per kWh, this equates to roughly 3.3 to 4.3 cents per mile—approximately two to three times cheaper than gasoline.
For example, drivers in Texas, with electricity costs around 8.6 cents per kWh, may save over $1,200 annually on fuel costs by switching to an EV. Even in states with higher electricity rates, EV fueling remains more economical on a per-mile basis than gasoline.
Maintenance Intervals and Service Costs
EV maintenance is generally simpler and less costly due to fewer mechanical components:
- Regenerative braking reduces brake wear, extending service intervals.
- EVs do not require oil changes, spark plug replacements, or transmission fluid servicing.
- Typical annual maintenance costs for EVs are 30-40% lower than for comparable gasoline vehicles.
Gasoline cars require regular oil changes every 5,000 to 10,000 miles, along with periodic spark plug and transmission maintenance, leading to higher lifetime service costs.
Insurance Premiums: Higher but Manageable for EVs
Insurance premiums for EVs tend to be higher, averaging about 26% more than for gasoline cars in 2025. This premium reflects:
- Increased repair costs due to specialized parts and labor.
- Expensive battery replacements.
- Higher vehicle MSRP affecting total loss valuations.
For context, average monthly insurance premiums hover around $248 for gasoline vehicles, while EVs average $357. Tesla models, in particular, command premiums near the high end of this range.
Consumers can mitigate these costs by comparing insurers and exploring EV-specific insurance programs.
Depreciation Rates: Improving but Still Variable
Depreciation remains a critical and variable cost factor. Historically, EVs depreciated faster—averaging about $0.27 per mile compared to $0.11 per mile for ICE vehicles—due to rapid technology improvements and concerns about battery replacement.
Recent advances in battery durability, extended warranties (commonly 8 years or 100,000 miles), and growing acceptance of used EVs are beginning to slow depreciation rates. Nonetheless, EVs generally still experience faster value loss, especially premium models.
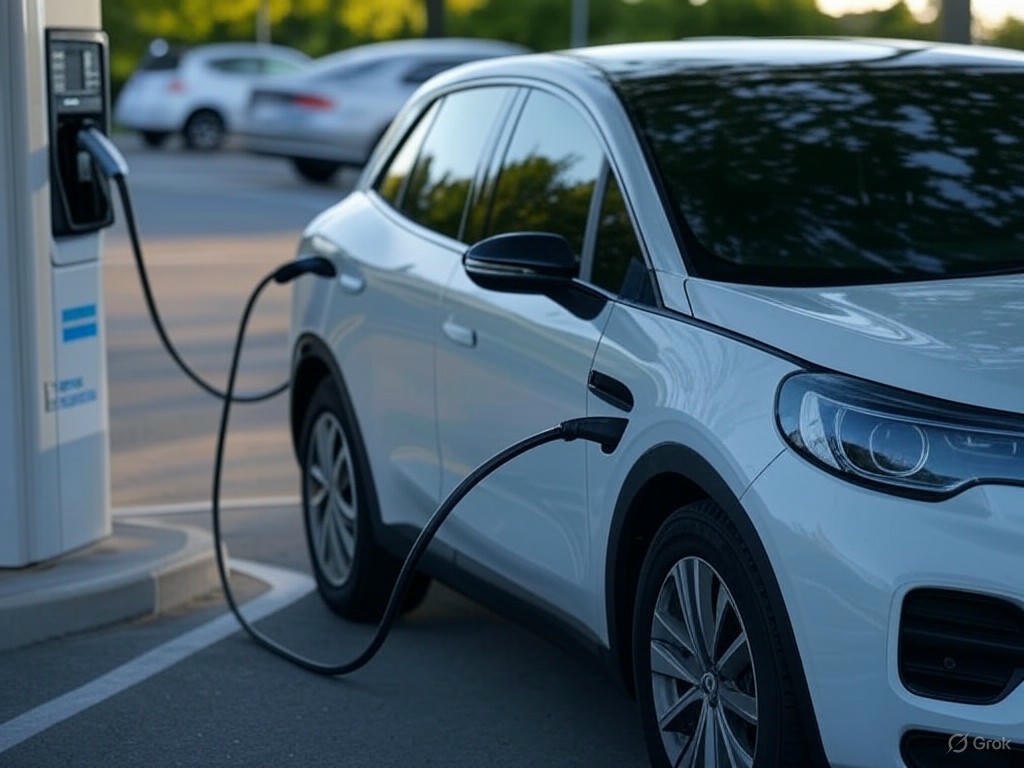
Charging Infrastructure and Installation Costs
Charging infrastructure adds unique upfront and ongoing costs for EV owners:
- Level 2 home charger installations cost between $500 and $2,500, with variation depending on electrical panel upgrades, wiring complexity, and labor.
- Level 1 charging (using a standard 120V outlet) is included with most EVs but provides slow charging (3-5 miles per hour), impractical for daily needs.
- Public fast charging is more expensive per mile but essential for long-distance travel and urban residents without home charging access.
Installation complexity depends on the home’s electrical system. Older homes often require panel upgrades costing between $1,200 and $4,000 to safely support Level 2 chargers.
Warranty Coverage Specifics
Most 2025 EV models offer comprehensive warranty coverage including:
- Drivetrain and battery warranties lasting 8 years or 100,000 miles, sometimes extending further for battery capacity retention.
- Bumper-to-bumper coverage ranging from 3 to 5 years or 36,000 to 60,000 miles.
Gasoline vehicles typically provide shorter battery warranties but similar basic coverage.
The extended battery warranty is a significant advantage for EV owners, reducing financial risks associated with one of the most expensive components.
Summary
- EV battery capacities range from 50 to 110 kWh, paired with electric motor efficiencies exceeding 90%, vastly outperforming gasoline engines operating at 25-30% efficiency.
- MSRPs for EVs average higher ($32,875 to $105,700) than gasoline cars ($20,000 to $40,000), but lower energy and maintenance costs help balance lifetime expenses.
- Fuel costs per mile favor EVs by roughly two to three times, driven by electricity rates and superior efficiency.
- EV maintenance is simpler and typically 30-40% less expensive, though insurance premiums are about 26% higher due to repair complexity and vehicle value.
- EV depreciation remains higher but is improving thanks to better battery technology and warranty coverage.
- Charging infrastructure costs for home installation range from $500 to $2,500, a unique upfront investment offset by long-term convenience and cost savings.
This detailed breakdown underscores that while EVs require a higher initial investment and incur higher insurance premiums, their superior energy efficiency and reduced maintenance costs provide compelling financial advantages over gasoline cars across a typical five-year ownership horizon.
| Technical Specification / Cost Component | Electric Vehicles (EVs) | Gasoline Vehicles |
|---|---|---|
| Battery Capacity / Fuel Tank Size | 50-110+ kWh (e.g., 57.5 kWh Tesla Model 3, 71 kWh Mercedes EQS SUV Maybach, 100+ kWh BYD TANG Flagship) | 12-21 gallons (e.g., 19 gal Toyota 4Runner, 12.4 gal Nissan Sentra) |
| Motor / Engine Efficiency | >90% electric motor efficiency | 25-30% internal combustion engine efficiency |
| MSRP Range (2025) | $32,875 (Hyundai Kona SE) to $105,700 (BMW i7 eDrive50 Sedan); Tesla Model 3 Long Range ~$57,900; Audi Q4 e-tron $58,200-$74,400 | $20,000-$25,000 (Nissan Sentra); $38,000-$40,000 (Toyota Highlander Hybrid) |
| Fuel / Energy Cost per Mile | 3.3 – 4.3 cents/mile (13¢/kWh avg, 3-4 miles/kWh efficiency) | ~10.6 cents/mile (gasoline $3.18/gal, ~30 MPG) |
| Maintenance Cost | 30-40% lower annual maintenance; no oil changes, spark plugs or transmission fluid; regenerative braking reduces brake wear | Higher maintenance costs; regular oil changes every 5,000-10,000 miles; spark plug and transmission service required |
| Insurance Premiums | ~26% higher; avg. $357/month; higher repair costs and vehicle MSRP | Avg. $248/month |
| Depreciation Rate | ~$0.27/mile; improving due to better battery durability, warranties, used EV market growth | ~$0.11/mile |
| Charging Infrastructure Costs | Level 2 home charger installation: $500-$2,500; possible electrical panel upgrades $1,200-$4,000; Level 1 charger included but slow | Not applicable |
| Warranty Coverage | Drivetrain & battery: 8 years/100,000 miles; bumper-to-bumper: 3-5 years or 36,000-60,000 miles | Shorter battery warranties; similar bumper-to-bumper coverage |
Fuel and Energy Costs Analysis: Efficiency, Regional Variability, and Charging Strategies
Fuel and Energy Costs Analysis: Efficiency, Regional Variability, and Charging Strategies
When evaluating fuel and energy costs for electric vehicles (EVs) versus gasoline-powered cars over a five-year ownership period, several critical factors come into play. Efficiency metrics, regional energy price variability, and charging behaviors significantly influence the total cost of ownership. This section dissects these components using 2025 data, real-world examples, and practical charging considerations to provide a comprehensive cost comparison.
Efficiency: MPGe vs. MPG in 2025
Electric vehicles maintain a clear advantage in energy efficiency, as measured by EPA ratings. Leading 2025 EV models like the Lucid Air Pure and the Volvo EX30 achieve combined MPGe ratings between 114 and 127 MPGe, with city driving efficiency reaching up to 124 MPGe. In contrast, fuel-efficient gasoline vehicles such as the 2025 Honda Civic average between 35 and 40 MPG.
To summarize efficiency:
- EVs: Top-tier models average approximately 115–125 MPGe combined.
- Gasoline cars: Efficient sedans and hybrids typically range from 30 to 45 MPG.
This translates to EVs delivering about 2.6 to 4.8 times more miles per unit of energy compared to internal combustion engines, per 2025 NRDC figures. However, raw MPGe alone does not determine cost-effectiveness; local energy prices heavily influence actual savings.
Regional Variability in Energy Costs
Electricity and gasoline prices vary substantially across U.S. states, impacting running costs for vehicle owners.
- Electricity rates: The 2025 U.S. average residential electricity price is approximately 16.4 cents per kWh. States like Idaho and North Dakota enjoy low rates near 9–10 cents per kWh, whereas Hawaii and California face rates exceeding 40 cents per kWh.
- Gasoline prices: The national average is about $3.15 per gallon (May 2025). High-cost states such as California and Hawaii report prices above $4.50 per gallon, while states like Mississippi and Oklahoma have prices below $3.00.
This disparity means that EV owners in low-cost electricity states (e.g., North Dakota, Idaho) benefit from notably lower per-mile energy expenses compared to gasoline vehicles. In states where both electricity and gasoline prices are high (e.g., California), the cost advantage of EVs narrows but generally remains favorable.
For example, charging a 115 MPGe EV in North Dakota at approximately 10 cents per kWh results in energy costs near $0.04 per mile. Meanwhile, a gasoline car achieving 35 MPG at $3.00 per gallon incurs about $0.086 per mile—more than double the EV’s energy cost.
Charging Modalities and Their Cost Implications
The choice of EV charging mode affects both convenience and cost, influencing daily expenses and overall ownership economics.
-
Level 1 Charging (120V AC): The slowest method, adding roughly 3–5 miles of range per hour. Ideal for overnight home charging with minimal installation cost. Electricity is billed at residential rates, typically between 10 and 20 cents per kWh.
-
Level 2 Charging (240V AC): The most common and practical home and workplace charging solution, providing a full charge in 4 to 8 hours. Home Level 2 charging costs align with residential electricity prices. Public Level 2 chargers vary widely—from free access to hourly fees up to $5 or per kWh billing.
-
DC Fast Charging (Level 3): Designed for rapid replenishment, adding 60 to 100 miles of range in about 20 minutes. These chargers are typically public stations with higher electricity costs, often ranging from $0.25 to $0.60 per kWh due to infrastructure and demand charges.
From a cost perspective, home charging—especially Level 2—is the most economical. It can save thousands of dollars over five years compared to frequent use of public DC fast chargers. Heavy reliance on fast charging can significantly increase energy expenses, sometimes approaching or exceeding gasoline costs per mile.
Off-Peak Charging and Time-of-Use (TOU) Rates
Many utilities offer time-of-use (TOU) electricity plans that incentivize EV owners to charge during off-peak hours, such as nights and weekends. Off-peak rates can be 30% to 50% lower than peak period prices, thus reducing charging costs substantially.
- For example, Alabama Power’s EV Night Charging Discount offers reduced rates between 9 p.m. and 5 a.m., potentially saving hundreds of dollars annually on electricity bills.
- Smart chargers programmed to capitalize on TOU pricing can maximize savings by scheduling charging sessions during these lower-cost periods.
Charging overnight not only aligns with typical EV owner routines but also enhances cost-effectiveness, lowering the total cost of ownership.
Energy Cost Comparison for Typical Annual Mileage
Assuming an average annual driving distance of 12,000 miles, the energy consumption and costs break down as follows:
- EV (115 MPGe): Consumes approximately 26 kWh per 100 miles, totaling about 3,120 kWh annually.
- Gasoline Car (35 MPG): Uses roughly 343 gallons per year.
Using average U.S. rates (16 cents per kWh electricity and $3.15 per gallon gasoline):
- EV energy cost: 3,120 kWh × $0.16 = $499 per year.
- Gasoline fuel cost: 343 gallons × $3.15 = $1,080 per year.
Even at higher electricity prices up to 30 cents per kWh, EVs generally remain cheaper to “fuel” than gasoline cars in most regions. However, in high-cost electricity states like Hawaii (above 40 cents per kWh), the cost advantage shrinks, especially when public fast charging is frequent.
Summary: Electric vehicles offer a significant efficiency edge and typically lower energy costs compared to gasoline cars over five years. However, the extent of savings varies regionally due to electricity and fuel price differences. Home charging during off-peak hours is key to maximizing cost benefits, while frequent use of public DC fast chargers can reduce or eliminate those savings. Prospective buyers should evaluate local energy prices, charging accessibility, and typical driving patterns to accurately estimate their five-year fuel and energy expenses.
| Category | Electric Vehicles (EVs) | Gasoline Cars |
|---|---|---|
| Efficiency (2025) | 114–127 MPGe combined; up to 124 MPGe city | 30–45 MPG |
| Energy Cost per Unit | Electricity: avg. 16.4¢/kWh (range 9–40+¢) | Gasoline: avg. $3.15/gal (range $3.00–$4.50+) |
| Typical Energy Cost per Mile (Example) | ~$0.04/mile (115 MPGe, 10¢/kWh) | ~$0.086/mile (35 MPG, $3.00/gal) |
| Annual Consumption (12,000 miles) | ~3,120 kWh | ~343 gallons |
| Annual Energy Cost (Average Rates) | $499 (3,120 kWh × $0.16) | $1,080 (343 gal × $3.15) |
| Charging Modalities | Level 1: 3–5 mi/hr, residential rates Level 2: full charge 4–8 hrs, residential/public rates vary DC Fast Charge: 60–100 mi/20 min, $0.25–$0.60/kWh | Not applicable |
| Charging Cost Impact | Home (Level 2) charging is most economical; frequent DC fast charging raises costs | Fuel cost stable but higher than EV energy cost in most regions |
| Regional Price Variability | Electricity: 9–10¢/kWh (Idaho, ND) to 40+¢/kWh (HI, CA) | Gasoline: <$3.00/gal (MS, OK) to >$4.50/gal (CA, HI) |
| Off-Peak Charging Savings | 30–50% lower rates during off-peak hours with TOU plans | Not applicable |
Maintenance, Repairs, and Insurance: Long-Term Cost and Reliability Insights
Maintenance, Repairs, and Insurance: Long-Term Cost and Reliability Insights
When evaluating electric vehicles (EVs) versus gasoline cars over a typical five-year ownership period, maintenance and repair costs emerge as a significant factor favoring EVs. However, this advantage comes with important nuances that prospective buyers should carefully consider.
Maintenance and Repair Costs: Quantifying the Differences
EVs benefit from simplified drivetrains with fewer moving parts, eliminating the need for oil changes and reducing mechanical wear. Regenerative braking technology recovers kinetic energy, substantially reducing brake pad and rotor wear. According to data from EV Connect, EV maintenance averages about $0.06 per mile, which can translate into approximately $4,600 in savings over the vehicle’s lifetime compared to gasoline vehicles.
That said, collision repair costs for EVs tend to be higher. Studies from SmartFinancial and InsideEVs report average post-accident repair bills for EVs around $6,000—25–30% higher than the roughly $4,700 average for gas vehicles. This premium largely results from expensive battery pack repairs or replacements and the complexity of EV electrical systems.
Regenerative braking not only extends brake component life but also contributes to improved battery longevity by reducing deep discharge cycles. Research from Virginia Tech and ScienceDirect confirms brake wear reductions of about 30% due to regenerative braking systems converting braking energy back into electrical energy. Nonetheless, some EV owners encounter issues like corrosion or uneven brake pad wear caused by infrequent mechanical brake use. Specialized ceramic or rust-resistant pads are sometimes necessary to maintain reliability and avoid costly brake repairs.
In contrast, gasoline vehicles require routine maintenance such as oil changes, transmission servicing, and fuel system upkeep. These tasks accumulate over time, especially as vehicles age. Bankrate’s analysis highlights that gas car maintenance averages about $0.10 per mile, with annual expenses including tires and repairs often exceeding $6,600. The complexity of internal combustion engine (ICE) components introduces more potential failure points, increasing maintenance time and costs over the long term.
Insurance Costs and Risk Factors in 2025
Insurance premiums for EVs remain notably higher than for gasoline cars. Despite advances in modular battery designs that have reduced repair costs, insurers in 2025 typically charge EV owners 26–44% higher premiums. The main drivers include elevated vehicle prices, specialized repair processes, and costly battery component replacements.
For example, the Nissan LEAF stands out as one of the most affordable EVs to insure, with average annual premiums near $1,900—comparable to some gasoline vehicles. Conversely, popular EV models like the Tesla Model Y command monthly insurance payments approaching $400, reflecting repair complexity and parts scarcity.
While insurance rate increases have moderated recently, EV premiums remain elevated overall. Factors such as driver history, geographic location, and credit score heavily influence individual premiums. States with limited EV infrastructure often experience higher insurance rates for EVs due to repair challenges. Therefore, prospective buyers should shop around and consider lower-cost EV models to manage insurance expenses.
Resale Value and Battery Warranty Considerations
Battery health and warranty coverage critically affect long-term EV ownership costs. Analysis by Geotab of over 10,000 EVs reveals average battery degradation of about 1.8% per year, with many batteries lasting well beyond 200,000 miles or 20 years under typical use. Automakers employ software buffers to limit charge extremes, further mitigating degradation.
Most EV batteries carry warranties of 8 years or 100,000 miles, providing owners with peace of mind. However, battery replacement remains a significant expense, often costing thousands of dollars, which directly impacts resale values. Although battery costs continue to decline, replacement remains a wildcard in total ownership economics.
The used EV market has seen volatility. After rapid price appreciation in recent years, used EV prices in some regions have begun to stabilize or even decline by 15–20% monthly due to a surge in lease returns. Nonetheless, many used EVs retain surprisingly strong value, particularly models like the BMW i3 or certain Tesla vehicles known for reliable battery performance.
Gasoline vehicles generally exhibit more predictable depreciation patterns, though their higher ongoing maintenance and fuel costs can erode savings over time. EVs, benefiting from fewer mechanical parts and lower routine maintenance, often offset their typically higher upfront price with reduced total cost of ownership.
Practical Takeaways
-
Maintenance Savings: EVs offer significantly lower routine maintenance costs due to the absence of oil changes and reduced brake wear from regenerative braking. However, collision repairs tend to be more expensive because of battery and electrical system complexities.
-
Insurance Premiums: EV insurance premiums remain higher on average, influenced by vehicle price and specialized repair needs, but vary widely by model and region. Selecting less expensive EVs and comparing insurance providers can help mitigate costs.
-
Battery Reliability: Modern EV batteries degrade slowly, with warranties providing substantial coverage. Battery replacement costs remain a key factor influencing resale value and ownership economics.
-
Resale Trends: Used EV prices are stabilizing after recent fluctuations, with some models holding value well. Gasoline vehicles typically depreciate more predictably but incur higher running costs.
In summary, EVs offer clear advantages in maintenance and repair savings over a five-year horizon, but higher insurance costs and battery considerations temper these benefits. Buyers prioritizing lower routine expenses, environmental impact, and technological innovation will find compelling value in EVs. Those concerned about repair complexity or resale uncertainties should weigh these factors carefully within their total cost of ownership framework.
| Cost/Aspect | Electric Vehicles (EVs) | Gasoline Vehicles |
|---|---|---|
| Maintenance Cost per Mile | $0.06 | $0.10 |
| 5-Year Maintenance Savings | Approximately $4,600 less | — |
| Collision Repair Average Cost | ~$6,000 (25–30% higher) | ~$4,700 |
| Brake Wear Reduction | About 30% less due to regenerative braking | Standard wear |
| Annual Maintenance & Repairs | Lower routine maintenance; no oil changes | Often exceeds $6,600 including tires and repairs |
| Insurance Premiums | 26–44% higher on average; e.g., Nissan LEAF ~$1,900/year, Tesla Model Y ~$4,800/year | Lower average premiums; varies by model |
| Battery Warranty | Typically 8 years / 100,000 miles | Not applicable |
| Battery Degradation | ~1.8% per year; batteries last >200,000 miles | Not applicable |
| Battery Replacement Cost | Thousands of dollars; significant ownership cost factor | Not applicable |
| Resale Value Trends | Volatile; some models retain strong value despite recent declines | More predictable depreciation |
Performance and User Experience Implications on Ownership Costs
Performance and User Experience Implications on Ownership Costs
When comparing electric vehicles (EVs) and gasoline-powered cars, raw performance metrics only tell part of the story. Factors like acceleration, driving range, and refueling or charging times directly influence daily convenience and can add indirect costs that impact the total five-year ownership economics.
Acceleration and Driving Dynamics: Beyond 0-60 mph
EVs consistently outperform many gasoline cars in acceleration, a key driver satisfaction and safety factor during merging or overtaking. For example, the 2025 Tesla Model S Plaid achieves 0-60 mph in under 2 seconds, rivaling supercars and far exceeding most conventional sedans. Luxury EVs such as the Audi RS E-Tron GT and Porsche Taycan Turbo S also deliver sports car-level responsiveness.
However, this performance advantage comes with some trade-offs:
- Energy Consumption Impact: Aggressive acceleration reduces EV range disproportionately, increasing charging frequency and downtime.
- Diminishing Practical Benefit: For typical urban or suburban driving, such blistering acceleration is rarely utilized, making the premium for high-performance EVs less justifiable from a cost perspective.
Gasoline vehicles remain competitive in steady-state highway cruising, often benefiting from quicker refueling and widespread fuel infrastructure.
Range and Refueling/Recharging: Core Convenience Factors
Most 2025 EVs offer EPA-rated ranges between 250 and 350 miles, comparable to many gasoline cars’ tank ranges. The critical difference lies in how these distances are replenished:
-
Gasoline Vehicles: Refueling takes about 5 minutes at any of the 145,000+ U.S. fueling stations, resulting in minimal downtime. Long-distance travel is typically seamless.
-
Electric Vehicles: Despite over 210,000 public chargers nationwide, charging times vary significantly:
- Level 3 DC fast chargers replenish up to 80% charge in 20–40 minutes, depending on vehicle and charger power.
- Level 2 chargers, common in homes and workplaces, require 4 to 8 hours for a full charge.
- Average public charging sessions last about 1 hour and 17 minutes, substantially longer than gasoline refueling.
This longer downtime translates into indirect ownership costs, including time lost and potential alternative transportation needs during long trips.
Real-World Usage Scenarios and Infrastructure Impact on Costs
Urban Commuting
EVs excel in daily city driving. Most urban commutes fall well within EV range limits, and overnight home charging using Level 2 chargers allows owners to start each day with a full battery.
- Maintenance savings and lower energy costs—often about half the cost of gasoline per mile—boost overall cost efficiency.
- Dense urban charging infrastructure supports convenient top-ups, alleviating range anxiety.
Long-Distance Travel
Long-distance trips highlight current limitations of EV charging infrastructure and longer charging durations:
- Although public fast chargers are expanding, coverage gaps persist, especially in rural areas.
- Frequent 20–40 minute charging stops can add several hours compared to a quick 5-minute gas station refuel.
- Trip planning becomes essential; delays due to charger availability or faults increase indirect costs.
Gasoline vehicles maintain clear advantages here, with rapid refueling and nearly universal station availability reducing downtime and logistical complexity.
Downtime for Maintenance and Charging: Hidden Ownership Costs
EVs offer significant maintenance cost advantages—studies indicate about 50% lower lifetime maintenance costs compared to gas cars, thanks to fewer moving parts and no oil changes.
However, charging-related downtime introduces a new indirect cost dimension:
- Charging sessions, particularly during long trips, can cumulatively amount to several hours annually.
- Charger reliability issues, including malfunctions or congestion, may cause additional delays; repairing charging infrastructure is costly and can impact availability.
- These factors translate to time lost, possible need for rental vehicles or alternate transport, and reduced productivity, especially relevant for business owners or fleet operators.
Fleet data reveal downtime costs can exceed $400 per day, emphasizing the critical economic value of reliable, fast charging infrastructure.
User Experience Insights: Driver Feedback
Real-world user feedback aligns with these findings:
- Urban EV owners appreciate the quiet, smooth acceleration and the convenience of overnight home charging.
- Long-distance EV drivers report meticulous route planning to account for charging stops, sometimes extending trip durations by hours.
- Some users express frustration over inconsistent charging station reliability and slower-than-expected charging speeds.
- Gasoline car owners value quick refueling and uninterrupted driving but acknowledge higher fuel and maintenance expenses over time.
Summary: Performance and User Experience Shape Ownership Costs
- EVs provide superior acceleration and lower maintenance costs, benefiting urban and moderate-range drivers.
- Charging times and infrastructure gaps impose indirect costs absent in gasoline vehicles, particularly impacting long-distance travel convenience and time management.
- Gasoline vehicles offer rapid refueling and range flexibility but bear higher fuel and repair expenses.
- Prospective owners prioritizing performance and lower running costs may favor EVs, while those valuing minimal downtime and ease of long-distance travel may lean toward gasoline cars.
Understanding these nuanced trade-offs between performance and user experience is vital when projecting total five-year ownership costs beyond purchase price and fuel expenses. While evolving charging networks and vehicle capabilities will continue to narrow these gaps, as of 2025, these factors remain key determinants of practical cost efficiency.
| Aspect | Electric Vehicles (EVs) | Gasoline Vehicles |
|---|---|---|
| Acceleration | Superior; e.g., Tesla Model S Plaid 0-60 mph in under 2 seconds; sports car-level responsiveness | Less rapid acceleration; competitive steady-state highway cruising |
| Energy Consumption Impact | Aggressive acceleration reduces range disproportionately, increasing charging frequency and downtime | Less impact from acceleration on fuel consumption during typical use |
| Range (EPA-rated) | 250-350 miles | Comparable tank ranges |
| Refueling/Recharging Time | Level 3 DC fast charge: 20-40 min to 80%; Level 2 charge: 4-8 hours; Average public session ~1h 17m | ~5 minutes at 145,000+ fueling stations nationwide |
| Convenience for Urban Commuting | Excels; overnight home charging; lower energy & maintenance costs; dense urban charging infrastructure | Less efficient in fuel cost; more frequent maintenance |
| Convenience for Long-Distance Travel | Charging infrastructure gaps in rural areas; longer charging stops (20-40 min); requires trip planning | Rapid refueling; widespread stations; minimal downtime |
| Maintenance Costs | About 50% lower lifetime maintenance costs due to fewer moving parts, no oil changes | Higher maintenance costs |
| Downtime Related to Charging/Maintenance | Charging downtime can add hours annually; charger malfunctions and congestion cause delays; downtime costs can exceed $400/day for fleets | Minimal refueling downtime; maintenance downtime typically higher but less frequent |
| User Experience | Quiet, smooth acceleration; convenient home charging; frustration over charging reliability and speed on long trips | Quick refueling; uninterrupted driving; higher fuel and maintenance expenses acknowledged |
| Cost Implications | Lower running costs and maintenance benefit urban/moderate-range drivers; indirect costs from charging times | Higher fuel and repair costs; advantage in minimal downtime and range flexibility |
Comparative Cost Benchmarking: EVs vs Gas Cars Across Different Use Cases and Regions
Comparative Cost Benchmarking: EVs vs Gas Cars Across Different Use Cases and Regions
When assessing five-year ownership costs, outcomes vary significantly based on vehicle segment, geographic region, and driving behavior. This section breaks down the evidence-based cost dynamics for electric vehicles (EVs), gasoline-powered cars, and hybrids across compacts, sedans, and SUVs. Key factors include regional variations in fuel and electricity prices, depreciation patterns, and charging habits.
Ownership Costs by Vehicle Segment and Region
New electric vehicles continue to carry a noticeable upfront price premium in 2025. According to aggregated data from Premium Autos Inc., the average EV costs approximately $55,544—about $5,800 more than the average new gasoline vehicle priced at $49,740. However, this initial premium often diminishes significantly with federal tax credits up to $7,500, enhancing affordability for qualifying buyers.
Segment-specific insights include:
-
Compacts and Sedans: EVs typically offer a total ownership cost advantage over comparable gasoline cars. Fuel and maintenance savings play a major role here; EVs require no oil changes and have fewer moving parts, resulting in maintenance costs roughly 31% lower. Their electric drivetrains are 2.6 to 4.8 times more energy-efficient per mile than internal combustion engines, leading to substantially reduced fueling expenses.
-
SUVs: The ownership cost gap narrows for SUVs due to higher EV sticker prices and somewhat accelerated depreciation for certain models, such as the Nissan Leaf or Jaguar I-Pace, which can lose over 60% of value within five years. SUVs also tend to have higher average annual mileage—around 12,979 miles—making energy efficiency and fuel savings more impactful. For example, Tesla’s SUV models, despite incurring higher insurance premiums due to specialized repair costs, maintain favorable total ownership costs compared to gas-powered SUVs.
Hybrids occupy a middle ground in this spectrum. Models like the Toyota Corolla Hybrid lead in sedan class affordability, largely because of lower upfront costs combined with meaningful fuel savings. Hybrids typically save up to $1,500 annually on fuel compared to gas vehicles, while battery electric vehicles (BEVs) can save closer to $2,200 per year.
Regional Variations: High Gas Price States vs Low Electricity Cost Areas
Fuel and electricity prices critically influence ownership cost differences across regions. California exemplifies a high gas price state, with prices averaging $4.61 per gallon in late 2024, amplifying the operational savings of EVs.
-
High Gas Price States (e.g., California, Hawaii): EV owners in these regions realize significant fuel cost reductions. For instance, California drivers switching to an EV like the Tesla Model Y AWD might save over $1,200 annually on fuel. While states like California impose additional EV fees ranging from $30 to $400 per year, these charges typically only partially offset the overall savings, keeping EV ownership financially advantageous.
-
Low Electricity Cost Regions (e.g., Texas, Idaho): States with lower residential electricity rates—Texas averages about 8.6 cents per kWh—enhance the cost-effectiveness of EV ownership. Home charging during off-peak hours further minimizes expenses. That said, reliance on public fast charging, which can cost up to $0.60 per kWh, may reduce savings for drivers without consistent home charging access.
Nationally, the average residential electricity price in 2025 hovers around 16.8 cents per kWh. Exceptions exist in high-electricity-cost states like Alaska, where EV charging costs may approach or even exceed the equivalent fuel cost per mile. However, such cases are relatively uncommon.
Sensitivity to Annual Mileage, Charging Behavior, and Depreciation
Five-year ownership costs fluctuate notably with driving patterns, charging habits, and vehicle depreciation:
-
Annual Mileage: Higher mileage intensifies the cost benefits of EVs. Lower per-mile energy costs and reduced maintenance needs favor EVs for drivers covering more miles annually. For example, Tesla owners average about 8,786 miles yearly, whereas non-Tesla internal combustion engine (ICE) vehicles average approximately 6,235 miles. SUV drivers, who tend to drive more, see amplified fuel savings with EVs.
-
Charging Behavior: Home charging during off-peak hours represents the most economical strategy and is gentler on battery health. Conversely, frequent use of public fast chargers can triple charging costs and accelerate battery degradation. Efficient EV models with lower kWh consumption per 100 kilometers further reduce energy expenses. Features like cabin preconditioning while plugged in enhance range and efficiency, indirectly lowering costs.
-
Depreciation: EVs generally depreciate faster than gasoline vehicles. Some models experience over 60% value loss within five years, primarily due to battery longevity concerns and rapid technological advancements. However, strong brand recognition, as seen with Tesla, tends to stabilize resale values. Hybrids typically depreciate more slowly than BEVs but faster than traditional gas cars.
Insurance costs also merit attention. Luxury and premium EVs often carry higher insurance premiums, reflecting expensive repairs and specialized components. Notably, Tesla has introduced usage-based insurance programs in select states to help mitigate these costs.
Hybrid Alternatives in the Cost Equation
Hybrids offer a pragmatic alternative, blending lower upfront costs with fuel savings. Their smaller battery packs compared to BEVs translate to reduced initial investment and more predictable depreciation. While fuel savings fall short of BEVs, hybrids still outperform gasoline-only vehicles by approximately $1,500 annually in fuel costs.
Popular models such as the Hyundai Elantra Hybrid and Toyota Prius continue to excel in affordability and fuel economy. In regions characterized by high electricity prices or limited EV charging infrastructure, hybrids often present the most cost-effective ownership option.
Summary Table: Approximate 5-Year Ownership Cost Differentials by Vehicle Class and Region
| Vehicle Class | EV vs Gas Cost Difference (National Average) | High Gas Price State Savings* | Low Electricity Cost State Savings* | Hybrid vs Gas Savings* |
|---|---|---|---|---|
| Compact | +$1,000 with tax credit | –$2,500 | –$1,500 | –$1,200 |
| Sedan | –$500 (after tax credit) | –$3,000 | –$1,800 | –$1,500 |
| SUV | +$1,500 (due to depreciation & insurance) | –$2,000 | –$1,000 | –$1,000 |
* Negative values indicate savings compared to gasoline vehicles.
Final Takeaways
-
EVs offer the most pronounced ownership cost advantages in compact and sedan segments, especially in states with high gasoline prices and moderate electricity rates.
-
SUVs demonstrate more complex economics influenced by higher depreciation rates and elevated insurance premiums but still benefit from energy and maintenance savings.
-
Charging behavior critically affects total costs; home-based off-peak charging maximizes financial benefits and battery health.
-
Hybrids remain a practical, cost-effective alternative in regions with high electricity costs or limited EV infrastructure.
-
Buyers should carefully consider depreciation trends and insurance premiums as part of the ownership cost equation.
For drivers with high annual mileage in states like California or Texas and reliable home charging access, EVs can be the most economical choice over five years. Conversely, for those with lower mileage or residing in areas with high electricity costs, hybrids or efficient gasoline vehicles may offer better overall value.
Ultimately, total cost comparisons must integrate individual use cases, regional factors, and charging accessibility to enable evidence-based decisions beyond sticker prices or marketing narratives.
| Vehicle Class | EV vs Gas Cost Difference (National Average) | High Gas Price State Savings* | Low Electricity Cost State Savings* | Hybrid vs Gas Savings* |
|---|---|---|---|---|
| * Negative values indicate savings compared to gasoline vehicles. | ||||
| Compact | +$1,000 with tax credit | –$2,500 | –$1,500 | –$1,200 |
| Sedan | –$500 (after tax credit) | –$3,000 | –$1,800 | –$1,500 |
| SUV | +$1,500 (due to depreciation & insurance) | –$2,000 | –$1,000 | –$1,000 |
Final Verdict and Evidence-Based Recommendations for 2025 Buyers
Final Verdict and Evidence-Based Recommendations for 2025 Buyers
Five years of ownership data in 2025 present a clear trend: electric vehicles (EVs) are becoming increasingly cost-effective compared to gasoline-powered cars, though the optimal choice depends on individual circumstances. While EVs typically carry an upfront price premium—averaging about $55,500, approximately $5,800 higher than gas vehicles—the availability of federal tax credits up to $7,500 often narrows or reverses this gap. Over a five-year span, many EV owners can realize total cost savings of 20-30%, driven primarily by lower fuel and maintenance expenses.
When EV Ownership Makes the Most Financial Sense
EVs demonstrate their greatest financial advantage for drivers with higher annual mileage, particularly those who have reliable access to home charging. Electricity costs for EV charging are significantly lower than gasoline, often translating to under a dollar per gallon equivalent. This efficiency results in fuel expenses roughly half those of comparable gas cars. For instance, a mid-size SUV owner charging at home can save upwards of $10,000 over five years, with some scenarios reaching savings as high as $26,000.
Maintenance costs also favor EVs due to their simpler drivetrains. With fewer moving parts, no oil changes, and reduced brake wear from regenerative braking, EV repair and upkeep costs average about 50% less than internal combustion engine (ICE) vehicles. Unlike gasoline cars, which often face unpredictable and escalating repair bills as mileage increases, EVs provide a more stable and lower-cost ownership experience.
Urban and suburban drivers stand to benefit most, given better charging infrastructure and utility programs offering off-peak electricity rates. Regions such as California, Nevada, and the Northeast provide comprehensive charging networks that maximize convenience and cost savings. Additionally, drivers prioritizing environmental impact gain social and ecological benefits alongside financial returns.
Where Gas Cars Still Hold Advantages
Despite rapid EV advancements, gasoline vehicles retain relevance in specific scenarios. Buyers constrained by upfront budgets may find gas cars more accessible due to lower sticker prices and the absence of charging infrastructure installation costs.
Rural drivers often encounter challenges with EV ownership. Public fast-charging stations remain sparse outside major urban corridors, and cold weather exacerbates range reductions, intensifying range anxiety. Longer daily drives and limited charging options make gasoline vehicles more practical and sometimes more economical in these settings.
Battery longevity, while improving, remains a concern for some potential EV buyers. Replacement costs can be substantial, though warranties typically cover 8 years or 100,000 miles. Until battery technology and charging networks mature further, gas vehicles continue to offer predictable range and quick refueling unmatched by current EVs.
Practical Recommendations for 2025 Buyers
-
Assess Your Driving Habits: If you drive more than 15,000 miles annually with a consistent daily commute, an EV is likely to save you money over five years. For lower-mileage drivers or those with occasional long trips, gasoline cars or hybrids may offer more convenience and value.
-
Evaluate Charging Access: Home charging is a critical factor. Reliable overnight access to Level 2 charging (240V) significantly reduces total ownership costs. Without home charging, reliance on public fast chargers—which are more expensive per kWh and introduce time constraints—can diminish savings.
-
Consider Regional Factors: States like California, Nevada, and in the Northeast provide superior charging infrastructure and off-peak electricity rates, enhancing EV ownership benefits. Conversely, many rural areas and some states lack sufficient infrastructure, impacting convenience and cost-effectiveness.
-
Leverage Incentives and Financing: Utilize federal tax credits (up to $7,500) and state or local incentives to offset upfront costs. Leasing can also lower initial expenses, mitigate depreciation risk, and provide flexibility to upgrade to newer models featuring improved range and technology.
-
Choose Vehicle Type Wisely: Compact and midsize EVs are optimal for urban and suburban driving, balancing efficiency and cost. Larger vehicles or those used for towing may currently favor gasoline or hybrid models until battery technology advances further.
Transparency on Limitations and Future Trends
EV ownership in 2025 still faces limitations. Although charging infrastructure has expanded rapidly, it remains unevenly distributed, particularly in rural and lower-income areas. The May 2025 ANSI report and Carnegie Mellon research underscore ongoing gaps in coverage and interoperability, which can frustrate users.
Upfront costs continue to be a barrier despite falling battery prices and manufacturing improvements. Programs such as Forth Mobility’s loan offerings aim to ease access, yet many consumers still experience sticker shock.
Technological progress is accelerating: battery costs are projected to drop below $80 per kWh by 2026 (Goldman Sachs), and innovations like vehicle-to-grid (V2G) technology promise new value streams for owners. As charging networks grow in density and standardize protocols, and the second-hand EV market matures, the cost dynamics will increasingly favor electric vehicles.
Bottom Line
For most buyers in 2025, EVs represent a financially and environmentally sound choice over a five-year ownership horizon, especially if home charging is accessible and driving patterns are regular. Gasoline vehicles retain appeal for budget-conscious consumers and those residing in rural or infrastructure-poor regions.
A careful evaluation of your individual circumstances—including annual mileage, charging access, regional infrastructure, and available incentives—combined with awareness of the rapidly evolving EV technology landscape, will ensure that your vehicle choice is both practical and cost-effective today, while positioning you to benefit from ongoing improvements in electric mobility.
| Aspect | Electric Vehicles (EVs) | Gasoline Vehicles |
|---|---|---|
| Upfront Cost | Average $55,500 (approx. $5,800 higher than gas); Federal tax credits up to $7,500 available | Lower sticker price; No charging infrastructure costs |
| Fuel Cost (5 years) | Approximately 50% lower; Electricity costs under $1 per gallon equivalent | Higher fuel expenses; Gasoline prices fluctuate |
| Maintenance Costs | About 50% less due to simpler drivetrains, no oil changes, regenerative braking | Higher and less predictable repair costs as mileage increases |
| Best Use Cases | High annual mileage (>15,000 miles), reliable home charging, urban/suburban areas, environmental priorities | Budget constraints, rural driving, long daily drives, limited charging infrastructure |
| Charging Infrastructure | Improving but uneven; best in CA, NV, Northeast; home Level 2 charging critical | No infrastructure needed; quick refueling everywhere |
| Range & Convenience | Range anxiety in cold weather and rural areas; battery warranties 8 years/100,000 miles | Predictable range; fast refueling; no battery replacement concerns |
| Ownership Savings (5 years) | 20-30% total cost savings; example: mid-size SUV saves $10,000 to $26,000 | No significant savings compared to EV |
| Regional Advantages | States with strong infrastructure and off-peak rates: CA, NV, Northeast | More practical in rural and infrastructure-poor regions |
| Environmental Impact | Lower emissions; social and ecological benefits | Higher emissions; no environmental incentives |
| Future Trends | Battery costs dropping; V2G technology; expanding second-hand market | Technology less dynamic; stable but less innovative |

CASEKOO Official Blue for iPhone 17 Pro Max Case with 360 Spin Magnetic Stand [Camera Protection] [18FT Military Grade Protection] [Fit for MagSafe] Ring Grip Slim Matte 17 ProMax Case 6.9 Inch
$39.99 (as of September 21, 2025 06:39 GMT +00:00 - More infoProduct prices and availability are accurate as of the date/time indicated and are subject to change. Any price and availability information displayed on [relevant Amazon Site(s), as applicable] at the time of purchase will apply to the purchase of this product.)
Anker Nano Power Bank, Ultra-Slim 5,000mAh Magnetic Battery Pack, Qi2 Certified 15W Max Ultra-Fast MagSafe-Compatible Portable Charger, Ergonomic Design, for iPhone Air/17/16/15 Series (Not for Pixel)
$45.99 (as of September 21, 2025 06:39 GMT +00:00 - More infoProduct prices and availability are accurate as of the date/time indicated and are subject to change. Any price and availability information displayed on [relevant Amazon Site(s), as applicable] at the time of purchase will apply to the purchase of this product.)
Ailun 3 Pack for iPhone 17 Pro Max Privacy Screen Protector [6.9 inch]+ 3 Pack Camera Lens Protector with Installation Frame,Dynamic Island Compatible,Anti Spy Tempered Glass[9H Hardness]-HD
$9.99 (as of September 21, 2025 06:39 GMT +00:00 - More infoProduct prices and availability are accurate as of the date/time indicated and are subject to change. Any price and availability information displayed on [relevant Amazon Site(s), as applicable] at the time of purchase will apply to the purchase of this product.)
45W 2Pack Super Fast Charger USB C Dual Port Android Phone Charger Type C Fast Charging Block with 10FT Type-C Charger Cord for Samsung Galaxy S25/S25 Ultra/S25+/S24 Ultra/S24/S24+/S23/S22/iphone 17
$14.39 (as of September 21, 2025 06:39 GMT +00:00 - More infoProduct prices and availability are accurate as of the date/time indicated and are subject to change. Any price and availability information displayed on [relevant Amazon Site(s), as applicable] at the time of purchase will apply to the purchase of this product.)