5G Speed Test Results: How to Read Real-World Performance (Not a Fake City Crown)
Some later links are Amazon Associates. As an Amazon Associate, TelcoBlade earns from qualifying purchases. Live prices are on Amazon.
A 5g speed test real world is not a scoreboard. It is a labeled measurement at one place, one time, on one band. Operators often paste a city median or a 5G UW screenshot into a go/no-go decision and stop asking questions. That is the failure mode this tutorial fixes. The job is literacy plus a labeled field pass, not a homemade carrier crown.
Prerequisites: What You Need Before the First Field Pass
You need four things before trusting any screenshot.
A phone that can show a band or field readout when possible. If it can’t, the icon label still matters. I recommend a log template with columns for place, time, icon or label, band if known, downlink, uplink, and ping. One outdoor spot and one indoor spot at the same site. The ability to force LTE or avoid UW when high-band indoor is unusable. And two browser tabs open on the primary Opensignal USA Mobile Network Experience and Ookla US Speedtest Connectivity Report pages, with their date windows visible.
Before I trust a screenshot, the label template is already filled in. If it isn’t, the number means almost nothing.
Step 1: One Screenshot Is Not an SLA
A common failure mode looks like this. An operator sees “5G UW” next to 350 Mbps, assumes the site is fine, and signs off on a fixed wireless deployment. Six weeks later the indoor test shows 8 Mbps. The screenshot wasn’t wrong. It was labeled “parking lot, off-peak, mid-band.” The site is different.
The structural error is treating one test as a service level agreement. A single screenshot cannot answer whether the connection holds at 7 p.m., whether upload survives a VPN, or whether the building shell kills C-band by 30 dB.
The fix is simple. Label place, time, band, and metric before trusting speed. If any of those fields is missing, treat the number as anecdote. Not data.
That rule answers the old demand for “5g speeds US cities” without inventing a five-city scoreboard. City medians are context. Your site is a measurement.
✓ Checkpoint: You have written the rule “one screenshot is not an SLA” into your field log template. If a test has no place, time, band, and metric, it does not count.
Step 2: City Benches Are Models, Not Site Surveys
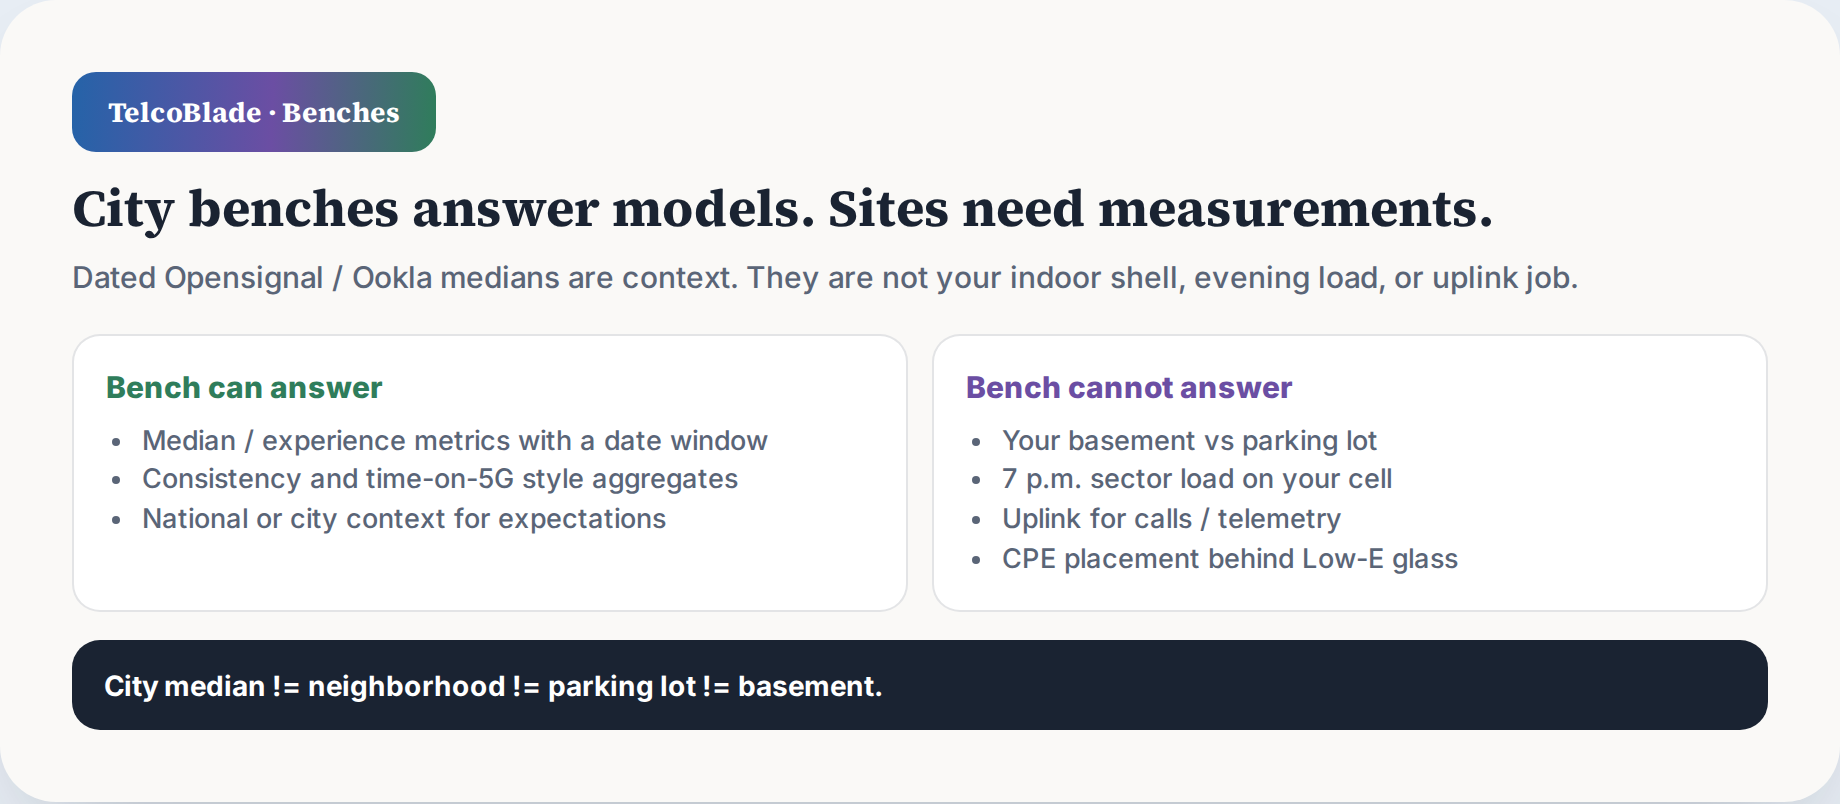
Opensignal and Ookla publish dated medians. That is what a city bench answers. A current Ookla U.S. FWA urban-rural report, for example, separates Q1 and Q2 2026 windows and shows urban FWA test samples pulling median multi-server latency 7 to 13 ms lower than rural samples, plus a rural-urban download gap (Ookla US FWA urban-rural report). In that same window, fewer than 40% of FWA Speedtest users in 48 states met the FCC 100 Mbps download / 20 Mbps upload standard (Ookla). Those are scoped, dated, real numbers. They do not tell you what happens in your basement.
The current Opensignal USA Mobile Network Experience page updates across states and metros; record the date window and read the methodology before repeating a metro number (Opensignal USA Mobile Network Experience). A city median is a model, not a measurement of your building. City median does not equal neighborhood does not equal parking lot does not equal basement. The sample behind a city score can skew toward certain devices, certain endpoints, or certain hours, even when the methodology filters extremes. Opensignal’s own approach tries to remove that bias by using one device, one vote and dropping failed tests, but it is still a crowd model (Opensignal methodology). Read the methodology before you repeat the number.
Uplink matters more than download for operator jobs. Video calls, telemetry upload, cloud backup. A 300 Mbps downlink with 4 Mbps uplink will break a Teams call. Latency and packet loss matter more than raw speed for control traffic. And Mbps is not MB/s. 100 Mbps is roughly 12.5 MB/s. If your file transfer utility says 12 MB/s and the test said 100 Mbps, that’s not throttling. That’s unit confusion.
✓ Checkpoint: You can separate what a bench answers from what it cannot. Your site’s indoor shell, evening sector load, uplink job, and CPE placement are not in the city median.
Step 3: The Icon Pretends to Be a Band
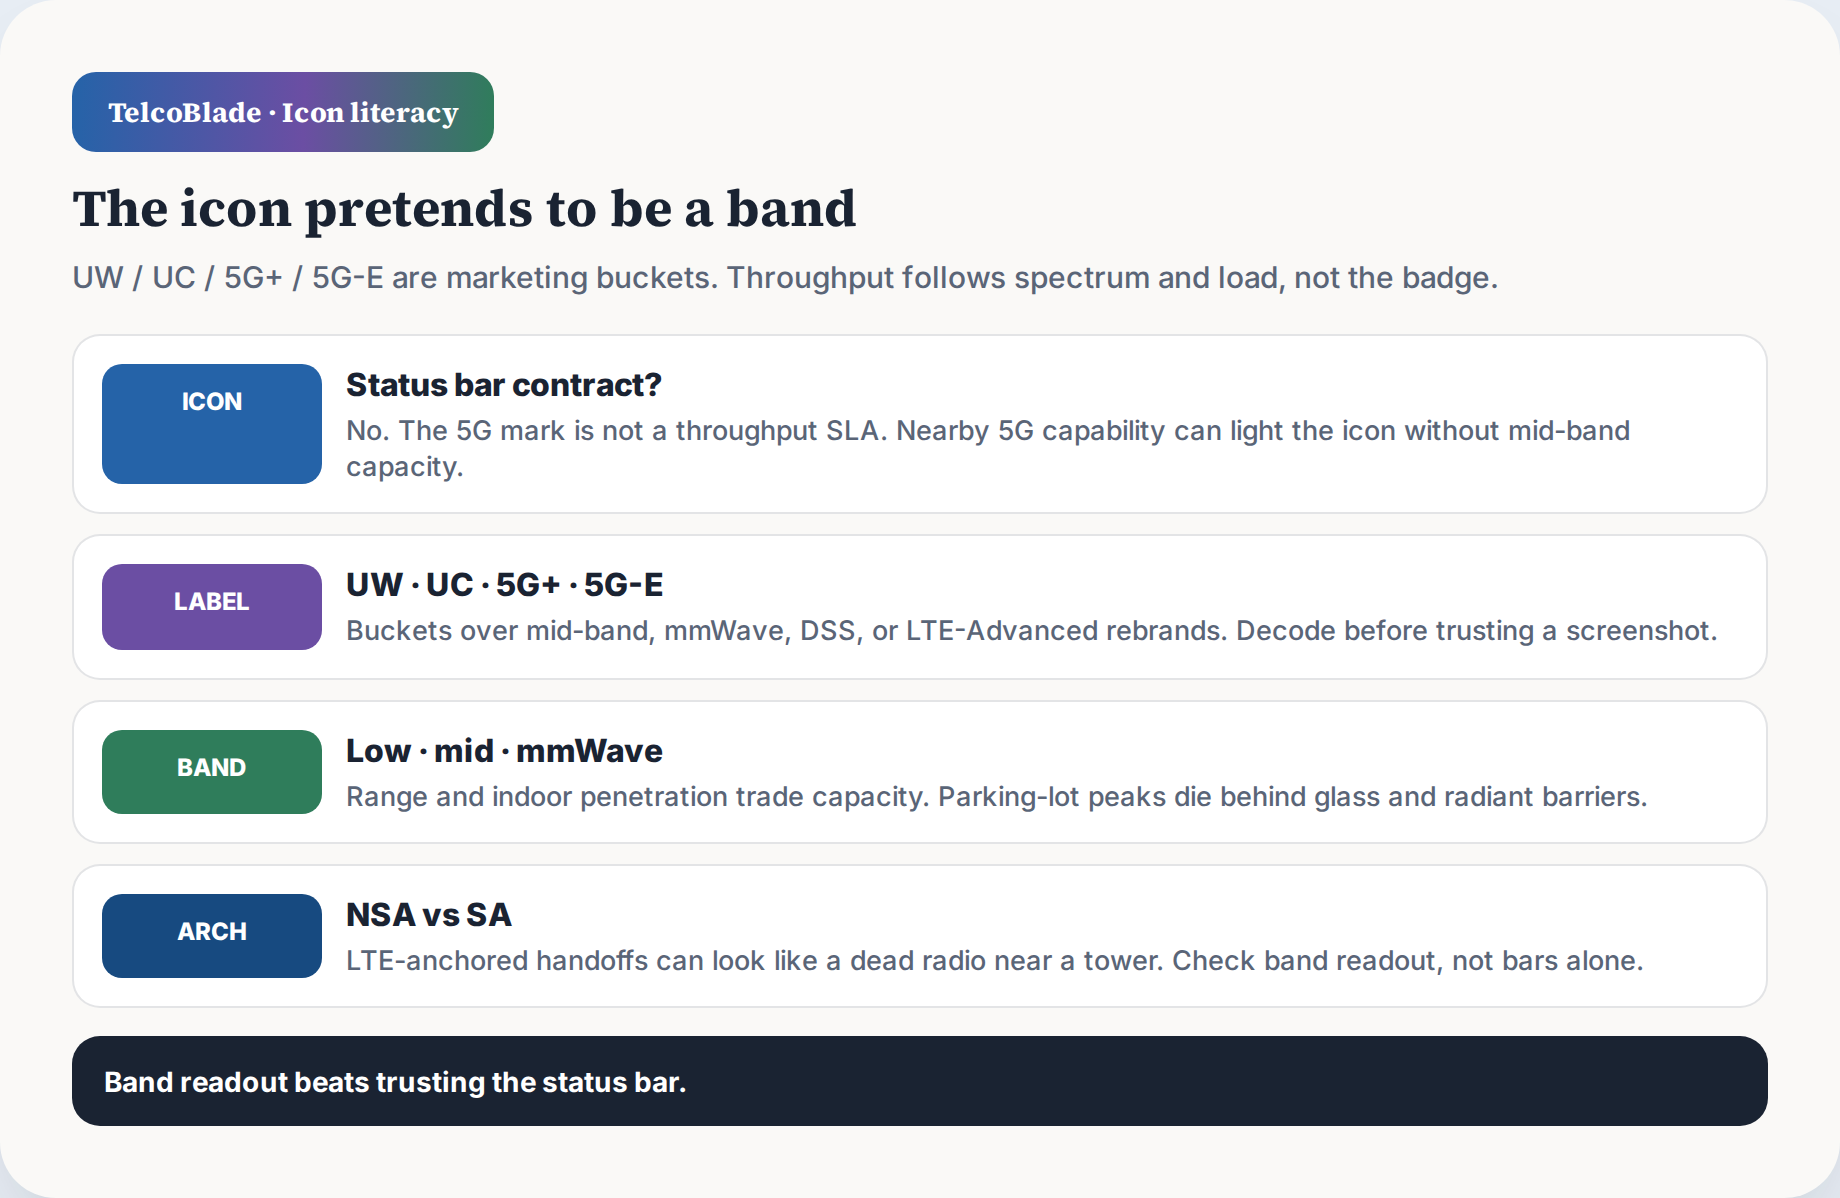
The 5G icon is not a throughput contract. It is a marketing bucket. UW, UC, 5G+, and 5G-E hide spectrum tiers. 5G-E is not 5G at all. It is LTE-Advanced with a new badge (The Verge icon guide). UW and UC can mean mid-band one minute and mmWave the next, depending on where you stand.
The three physical layers behave differently. Low-band 5G typically delivers 50 to 250 Mbps and penetrates walls. Mid-band, the sweet spot, usually lands between 200 and 700 Mbps. mmWave can hit 1,000 to 4,000 Mbps but only near line of sight (RealtimeSpeed 5G band guide). The icon does not tell you which one you are on.
NSA versus SA adds another failure mode. Early 5G NSA anchors to LTE for control. Your phone can be on mid-band data while LTE handles signaling. During a handoff, the phone may briefly show 5G but feel dead near a tower. That is not a tower problem. It is the anchor shifting.
Same plan, different phones can behave differently. Modem variance is real. One device holds n41, another bounces to n71. Band readout beats icon trust. On Android, field tools or dialer codes can show the actual band. If you can’t see the band, at least log the icon and treat it with suspicion.
✓ Checkpoint: You have a three-row cheat sheet in your head: low band for reach, mid band for capacity, mmWave for line-of-sight peaks. The status bar is a hint, not a spectrum analyzer.
Step 4: The Building Is Part of the Radio Path
A C-band test in a parking lot hits 600 Mbps. The same phone twelve feet inside the building, behind Low-E glass, drops to 15. The icon still says 5G UW. This is not a carrier failure. The building is absorbing the signal.
Low-E glass is a silent killer. At 3.5 GHz it can add 25 to 35 dB of loss. At 28 GHz it hits 30 to 40 dB (RF Essentials building penetration loss). Radiant barriers and metal insulation do the same in older ranch houses. Low-band 5G keeps the icon alive with LTE-like capacity because it punches through these materials better, but it will not give you mid-band speed.
Window or exterior wall placement for hotspots and FWA CPE comes before any booster shopping. Move the device first. Test the window before you buy anything. If you are triaging between cellular WAN and home Wi-Fi, the same placement-first logic applies; a home Wi-Fi versus cellular WAN triage can save you from buying the wrong layer. If mid-band or UW is unusable indoors, forcing LTE is rational triage. A stable 40 Mbps LTE link beats a flapping 5G UC signal that drops every ninety seconds.
✓ Checkpoint: You know the parking lot peak and the indoor crash can share the same icon. You have an indoor/outdoor placement decision, not a purchase decision.
Step 5: The 3 AM Test Is a Lie About Evening Load
A test at 3 a.m. shows excellent download. At 7 p.m. the same site crawls. That is not a device fault. That is sector load.
Bars fine, data crawls is the classic symptom of congestion or deprioritization. Bars measure signal strength, not capacity. A strong signal into a crowded sector still queues.
FWA and MVNO deprioritization is structural, not a personal vendetta. Some plans get lower priority when the network is busy. At evening peak, that difference becomes visible. A 3 a.m. test proves the network when nobody else is on it. If the test only runs at 3 a.m., it only proves the network at 3 a.m.
Backhaul ceiling is another quiet killer. The radio generation can be 5G while the tower’s fiber or microwave backhaul is saturated. Radio generation does not equal pipe capacity.
Before blaming the tower, check the device. Power saver, data saver, roaming, dual-SIM, and VPN can all throttle or reroute traffic. Disable them one at a time and retest.
✓ Checkpoint: You have an evening versus off-peak comparison habit. The 3 a.m. number is now labeled “off-peak, not SLA.”
Step 6: Read Primary Reports Without Buying the Crown
Secondary winner listicles take a primary report and strip the date, methodology, and metric definitions. Then they crown a carrier. Do not repeat that crown.
Prefer the primary Opensignal USA Mobile Network Experience and Ookla US Speedtest Connectivity Report pages. Note the date window; reports update on their own schedule, so if you quote one, write down the date window you used. Ookla’s Q2 2026 FWA data and Opensignal’s current US experience page are not the same season, not the same metric, not the same sample. That mismatch is why one screenshot or one roundup cannot become a site survey.
Note the metric. Opensignal’s download speed is a median of stable speed during a fixed time test. Ookla’s Speed Score blends download and upload. Consistency is not the same as median. Time on 5G is not signal quality. If the metric definition is not stated, the number is marketing.
Sample bias warning applies to every crowd source. Unusual endpoints can distort city speed folklore. Read the methodology before you repeat the crown. Use benches as context for a field pass, not as a substitute for one.
✓ Checkpoint: You can identify the metric and date window from a primary report before quoting a number.
Step 7: The Labeled Field-Pass Checklist
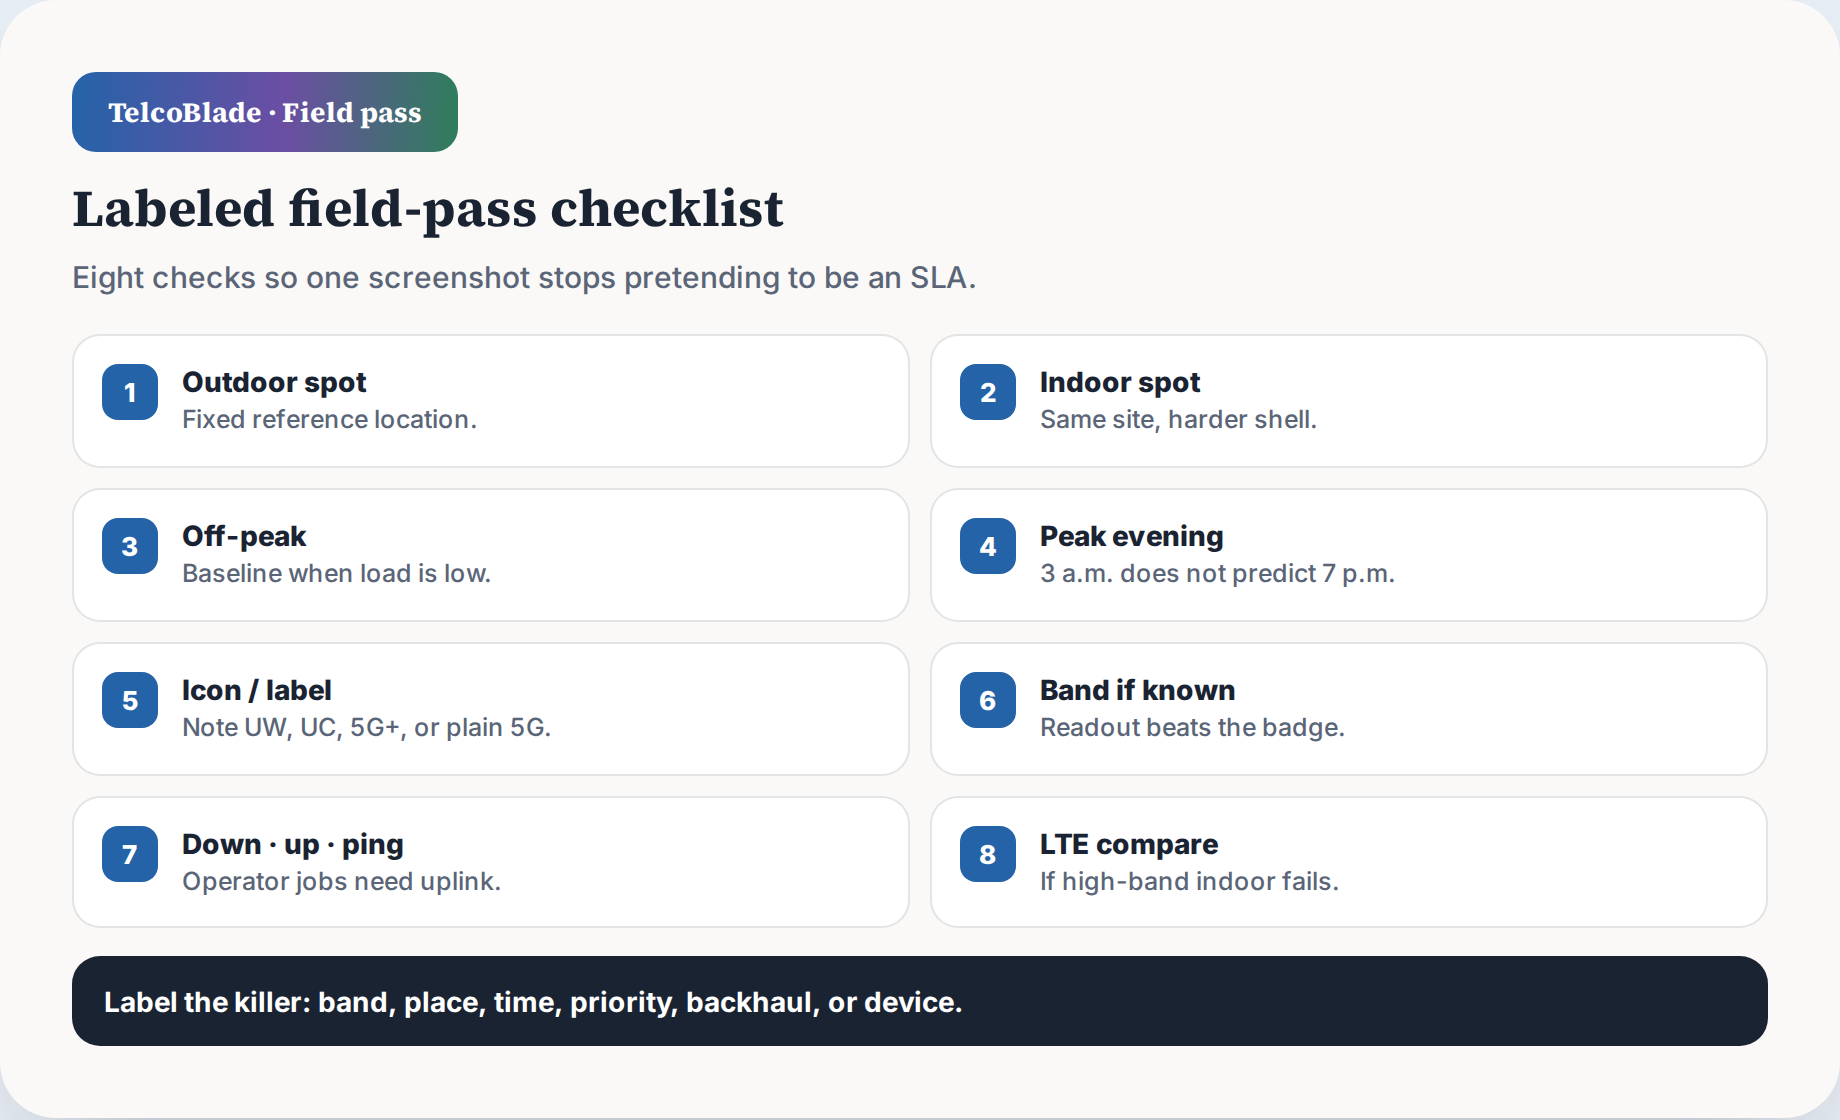
Run this checklist for any site that matters.
- Test outdoor and indoor at the same address.
- Test peak and off-peak.
- Note the icon or label: 5G, 5G UW, 5G UC, 5G+, 5G-E, LTE.
- Record the band if your phone can show it.
- Record downlink, uplink, and ping, not just down.
- If high-band is unusable indoors, force LTE and compare.
- Record exact place and time for every test.
- Move the CPE or hotspot to a window or exterior wall and retest.
- Label the killer from this list: band, place, time, priority, backhaul, or device.
- Decide based on the labeled pass, not a screenshot.
The checklist exists so you stop treating one screenshot as an SLA. If the bench says excellent and the site says otherwise, trust the site.
✓ Checkpoint: You have a completed labeled pass. The decision rule is band, place, time, priority, backhaul, or device. Pick one, then fix or accept.
Troubleshooting Common Issues
Symptom: 5G icon but LTE-like speed. Fix: check band. You are likely on low-band 5G. Force LTE and compare.
Symptom: Strong bars, high ping, data crawls. Fix: test evening peak. It is congestion or deprioritization, not signal.
Symptom: UW outdoor fine, indoor dead. Fix: check building materials. Low-E glass or radiant barrier. Move device to window or force LTE.
Symptom: Phone prefers weak 5G over strong LTE. Fix: toggle airplane mode to force reconnect. If LTE is better, set LTE preferred.
Symptom: Evening FWA crawl. Fix: record time. It is likely sector load or FWA deprioritization. Test off-peak to confirm.
Symptom: Bench says excellent, site fails. Fix: trust the site. The bench is a model. Run the labeled field pass.